Option-Price Forecasting Isn't as Black and White as it Seems
On Monday, our Options Shark advisory service took on a couple of new trades, including a bearish/put position in Seagate Technology (STX). Though we normally don't discuss live trades that are quite this new -- just to be fair to paying members -- this is one that's already far enough ahead for our subscribers that they won't care. Besides, the learning aspect of this trade is too good to pass up, in that it allows us to illustrate how we choose a particular option over another one, and how we can do se effectively.
First things first. On the off-chance you're reading this and don't know, a put is essentially a bet that a particular stock is going to move lower. As STX sinks in value, the value of our put contracts rises. And, with Seagate Technology shares hitting new multi-week lows on Monday and simultaneously pulling under the 200-day moving average line in the process, we've got good reason to believe things just went from bad to worse for STX.
For the purposes of the discussion we'll simplify the matter and say the chart itself was signaling that the downside potential suggested a month or so of selling was in the cards. As such, options expiring a little more than a month from now are ideal. [Always buy a little more, though not a lot more, time than you think you'll need.] In this case, the options expiring on July 21st, or 40 days from now, are perfectly suited. The question is, which one?
Although we don't necessarily crunch the numbers every time we place a trade, subconsciously, we do consider all the possible scenarios in a search for the ideal risk/reward possibility. And to do that, we have to make a comparison of all the reasonable choices of put options that were somewhere near the stock's current price of $41.19. The table below tells the tale of each strike price's upside and downside as it may stand come July 21st.
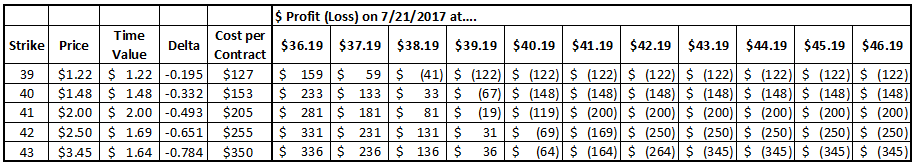
Obviously the put option with the 44 strike would cost the most at $400 per contract, but they would also yield the biggest dollar gain since they're the deepest in the money. At the other end of the spectrum the 40 puts are out of the money, but dirt-cheap at $1.48, or $153 per contract when factoring in commissions. That contract would only be worth $386 if Seagate shares were to be at $36.19 by July 21st, whereas the 44 puts would be worth $786. In terms of percentage gains on the amount of money allocated toward a particular trade though, the 40 strike holds the most upside... but also the most downside. To that end...
The return on your total investment is far more important than the absolute gain (or loss) on a trade, so to better visualize the upside and downside of the above scenarios, the table below gives the percentage gain or loss potential for each trade under each price scenario.

Obviously any price above $41 at expiration would be disastrous, though we wouldn't necessarily hang onto anything that long if it wasn't moving in our favor well before then.
These tables are surprising to many traders, in that the biggest reward lies with the cheaper, out of the money puts but without a whole lot of additional risk should the worst-case scenario be realized. The flipside is, the loss on the cheaper out-of-the-money puts can get real big, real fast should STX decide to move higher instead of continuing to move lower.
The biggest eye-opener of all, however, is that in all cases time decay -- or theta -- took a big toll whether you were in the money, at the money, or out of the money. This is a situation where you'll pay a price even if the stock doesn't move a whole lot. In other words, stagnation can hurt you too. Theta, or time decay, is pretty significant for these volatile stocks. It's particularly troublesome for the out-of-the-money options on volatile stocks.
To that end, one more point has to be made about the aforementioned gain/loss scenarios. That is, they assumed we were making an exit the same day the options expired, after all the time decay possible had taken its maximum toll. That math can change rapidly the closer you get to expiration.
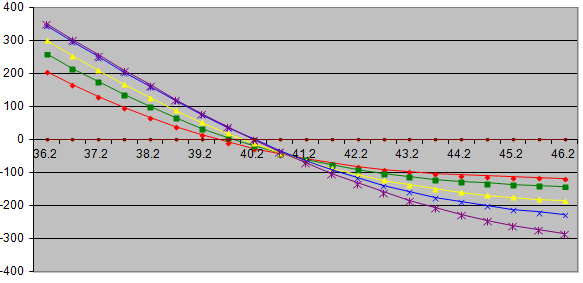
Just to paint that picture, here's a graphical representation for the profit/loss scenarios of all five strikes on expiration day.

And, here's the same P&L comparison just 20 days away, or only halfway to expiration. The gain/loss scenario changes with time, and that's mostly due to the effects of time decay, or theta.
The biggest potential winners are still the biggest potential losers, but the relative risk and reward is diminished if you're looking to get out before expiration day. Broadly speaking, there's more upside in an early exit than downside, even if the stock moves against you. That's why we generally recommend buying yourself plenty of time, which requires you to make a judgment call about how long a trend might last. Doing this kind of analysis also forces you to at least set a mental target for an option trade.
Perhaps more than anything though, this type of comparative analysis really opens your eyes to the importance of a high delta and a low theta. Option price scenarios aren't always what they seem they should be.
As for which put option we ended up buying in the Options Shark service, that's going to remain a secret for now (though we may revisit this lesson once the position is closed out -- there's a lot to be learned here).
If you'd like to learn more about our Options Shark newsletter or become a subscriber, go here.