Weekly Market Outlook - Don't Load Up On New Bullish Trades Just Yet
The market didn't end the week on a high note. But, it doesn't matter. It sang some seriously high notes in the middle of the week, translating into a 1.8% advance for the S&P 500 in just four trading days. The move also carried the index above its pivotal 50-day moving average line.
It was a far-from-idea effort though. Namely, a couple of gaps were left behind, now begging the market for a pullback to fill them in. There was a noticeable lack of volume behind the move too. Despite the headlines implying the trade impasse could be coming to a close, investors remain nervous that the calendar is working against them. That's especially true if it's going to take some time for the global economy to fully heal from its recent illness.
We'll take a detailed look at what went wrong and right for the market below, as always. First though, let's paint a picture using the broad brush strokes of economic news. We got a biggie last week.
Economic Data Analysis
A very busy week last week, culminating in a confusing employment report for August. But, there were some heavy-hitters well before then.
Case in point: We heard both ISM index scores last week. They painted a mixed message a well. The ISM Manufacturing survey fell below the pivotal 50 level last month, reaching 49.1. But, the ISM Services score pushed upward to 56.4.
ISM Survey Charts
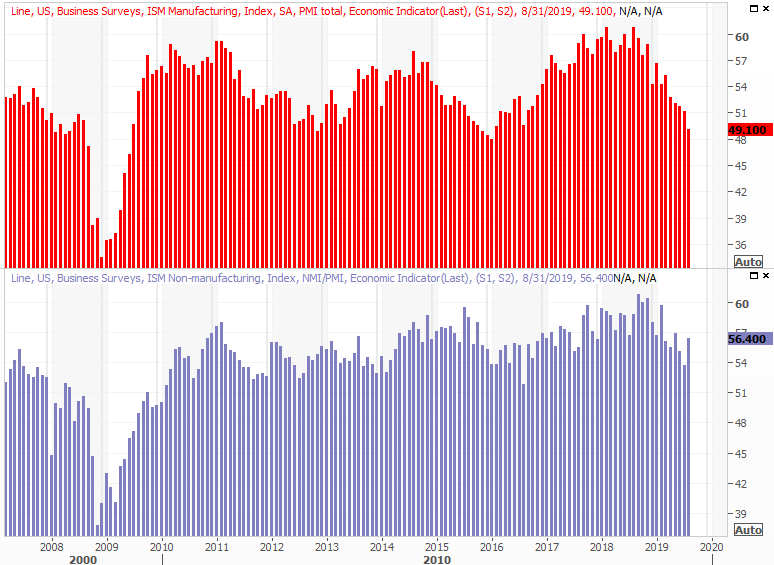
Source: Thomson Reuters
It's a problem that jibes with all the rhetoric that the trade impasse with China is taking a toll in the nation's factories. But, there's a key detail to understand about the ISM data. It's a survey, and survey responses are often reflections of how people in the industry feel rather than fiscal data. The rhetoric may be making managers feel as if business is worse than it really is.
On the flipside, there is more industrial-related data that does indicate a true headwind, even if it's not yet pushing industrial output backwards.
It was also a key week for auto sales figures. They're still lethargic in terms of growth, but holding steady in an environment like this one is impressive. The annualized rate now stands at 17.5 million, and as has been the case for some time, truck sales are offsetting deteriorating sedan sales.
Auto Sales Charts
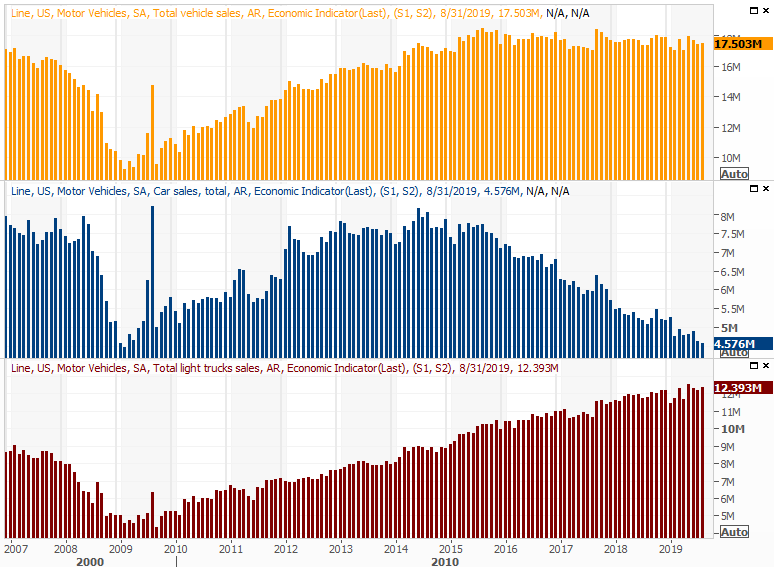
Source: Thomson Reuters
Finally, last month's payroll growth fell short of expectations... by a long shot. But, don't worry too much. The August figure is usually squirrely, and everything else about the report looked encouraging. All other data suggests the impasse is not enough willing and able workers to fill positions.
Payroll Growth, Unemployment Rate Charts
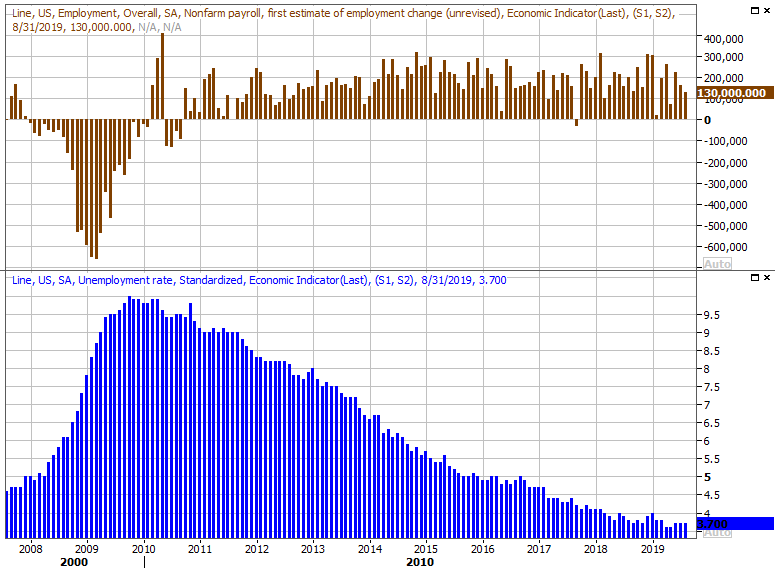
Source: Thomson Reuters
We detailed the 'rest of the story' at the website.
Everything else is on the grid.
Economic Calendar
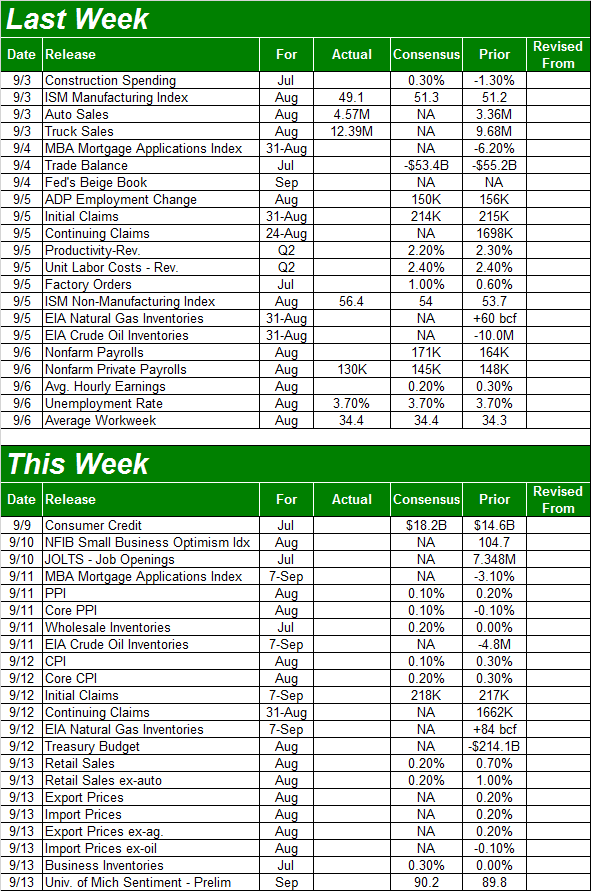
Source: Briefing.com
This week's pretty well loaded, though only a couple of data sets are worth previewing.
It's a huge week for the interest rate discussions, as we'll be hearing about last month's producer inflation rate on Wednesday, and consumer inflation on Thursday. Despite rock-bottom borrowing costs, economists don't expect rampant price increases. In fact, they're looking for price increases to cool off.
Producer, Consumer Inflation Charts
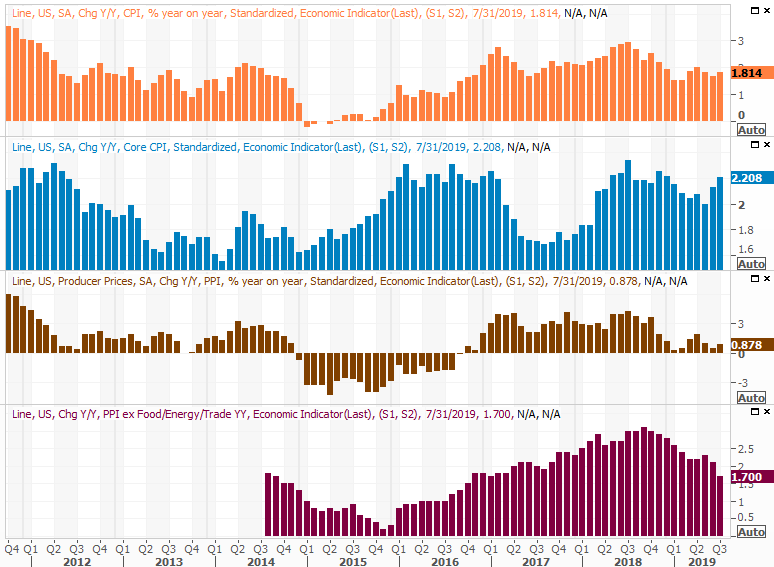
Source: Thomson Reuters
On Friday we'll hear about August's retail sales, indicating how healthy the average consumer is feeling. Other data from a week ago suggests people are spending the extra money they're making, and then some. The pros believe they're cut back a bit for last month, but even then, spending remains strong if the data matches or exceeds estimates.
Retail Sales Charts
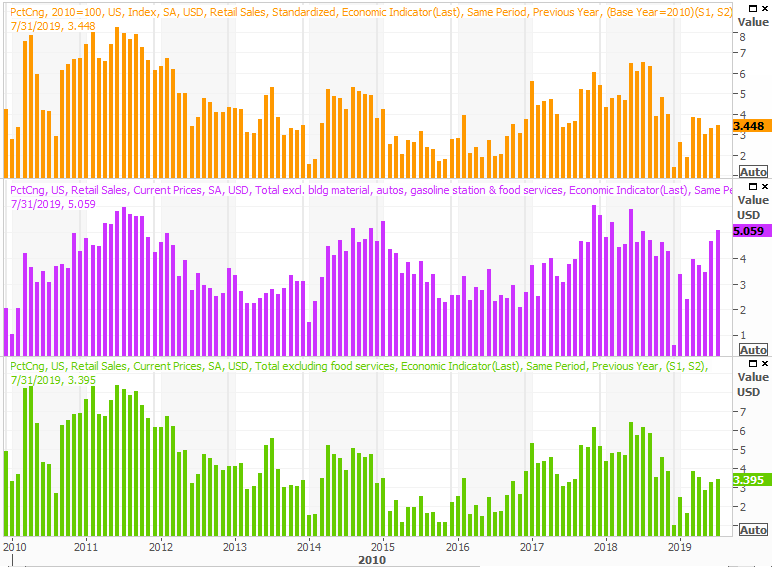
Source: Thomson Reuters
Stock Market Index Analysis
The good news: Last week, the market's key indices pushed past the technical resistance they struggled to clear the week before. The bad news: The move didn't take shape in the most compelling fashion. As was noted, a couple of different gaps were left behind that may now be pressured to be filled in. That bearish pressure could readily turn into a full-blown downtrend.
S&P 500 Daily Chart, with VIX, Volume
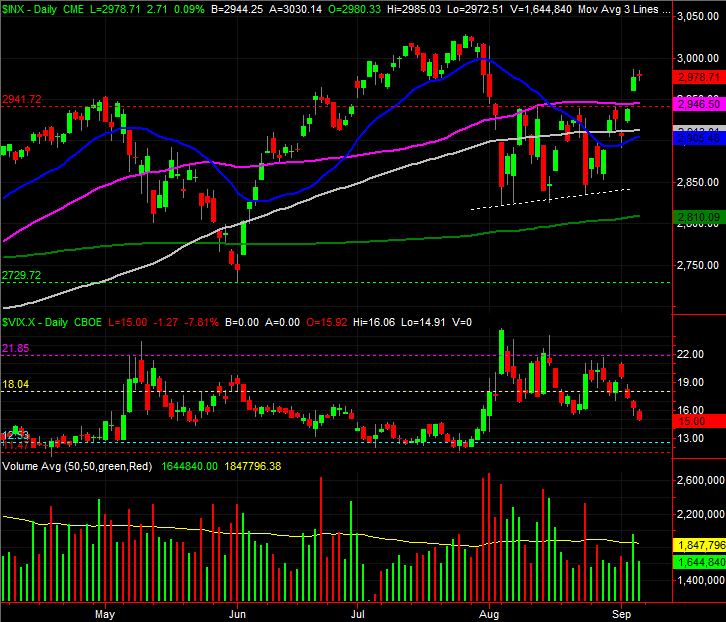
Source: TradeStation
That's the problem when investors get a little too excited too quickly about headlines and fail to pace themselves. The euphoria can fade just as quickly as it forms. And, the fact of the matter is, the economy is still as much of a question mark now as it was a week ago, even though a week ago investors didn't feel like there was any clarity on the matter. Perception is everything.
As always, backing out to the weekly chart puts things in perspective. From this view we can see that while last week's advance was a nice follow-through on the previous week's rebound, there's only a little more room to continue rallying before a well-established technical ceiling is re-encountered ... the line that connects all the key highs going back to the beginning of 2018.
S&P 500 Weekly Chart, with VIX, Volume
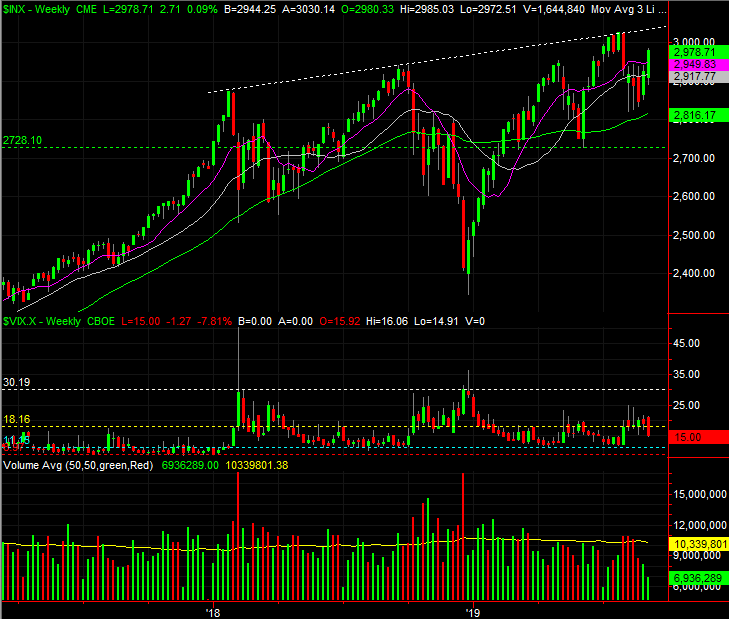
Source: TradeStation
The whole scenario is a problematic one, however, for several reasons.
In retrospect, the abnormally high TRIN readings and oddly high put/call ratio levels we discussed at the website a little over a week ago did end up being the buy signals we feared they were. Both have started to reverse those extreme readings too. But, neither pullback from the TRIN or put/call ratio has fully run its course yet, meaning there's still technically some upside left to play out. The distance between the S&P 500's current value of 2978 and that upper ceiling near 3037 is more or less the right distance to let the put/call level and the TRIN reading, or Arms Index, to get back to more nominal levels.
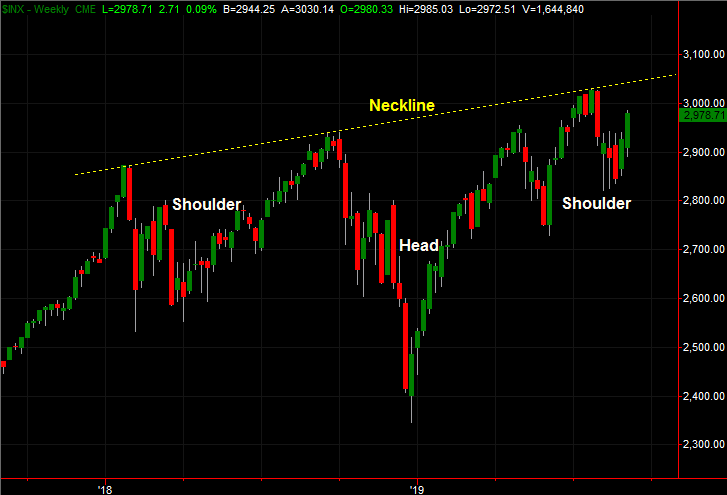
The problem? If the index manages to keep building on that momentum and blast past that resistance level, it could keep going. Although not quite a textbook-caliber example, the action since early last year constitutes an upside-down head-and-shoulders pattern that often catapults the chart well above the neckline.
S&P 500 Weekly Chart, with Head and Shoulders Pattern
Source: TradeStation
If the bulls play their cards right and pace themselves between here and there, the S&P 500 could be at the make-or-break line in the sand right around the time the usual September (and early October) weakness comes to a close and leads into the usual fourth quarter rally.
That's still problematic this time around though.
Incredibly enough, as rocky as things have been this year, the S&P 500's path is still ahead of schedule, so to speak. That is to say, in the average year the index would be up 4.6%. So far for 2019 though, the S&P 500 is up 18.8%.
S&P 500 YTD Performance vs. Norm

Source: TradeNavigator
Except, maybe that concern is unmerited.
While this year's gain has been impressive, it would be naive to not acknowledge the bulk of the big move was spurred by a stunningly big setback during the fourth quarter of last year. On balance, we're not too far off-track when looking beyond the oddity that is 2019. In fact, in just looking at the way the market behaves over the course of a typical four-year presidential cycle, the S&P 500 is ahead of its usual pace, but it's not out of character for a bullish four-year span. It's right on track, in fact.
S&P 500 Performance vs. Norm During Four-Year Presidential Term
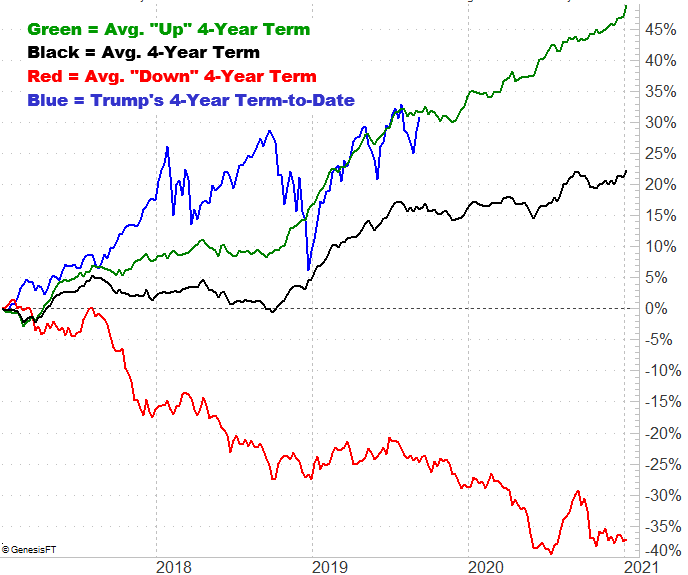
Source: TradeNavigator
Even this is challenging though. Though each year of a four-year term behaves similarly to the other three, for whatever reason, the third year's usual fall lull tends to last through November... even when the undertow is bullish.
This prospect clearly calls into question the potential of a breakout from a head-and-shoulders setup. Indeed, assume nothing here. This dance is very much a day-by-day affair.