
Traders who are being intellectually honest with themselves had to know it would come down to this. The market took a tumble beginning late last month and early this month, but that 6% setback from the high was just a garden variety wave of profit-taking. What happens from here will require some risk-taking, and possibly set the stage for what's to come for the foreseeable future.
And it's all going to come to a head this week.
The showdown, so to speak, will be what happens if-and-when the S&P 500 tests the technical floor that's been made by all the lows since early August. It's currently at 2836, and rising. The index fell to within striking distance of that mark as of Tuesday. And, it did so because the 20-day moving average line plotted in blue acted as a technical ceiling. Also notices there's some horizontal resistance at 2939, marked with a red dashed line.
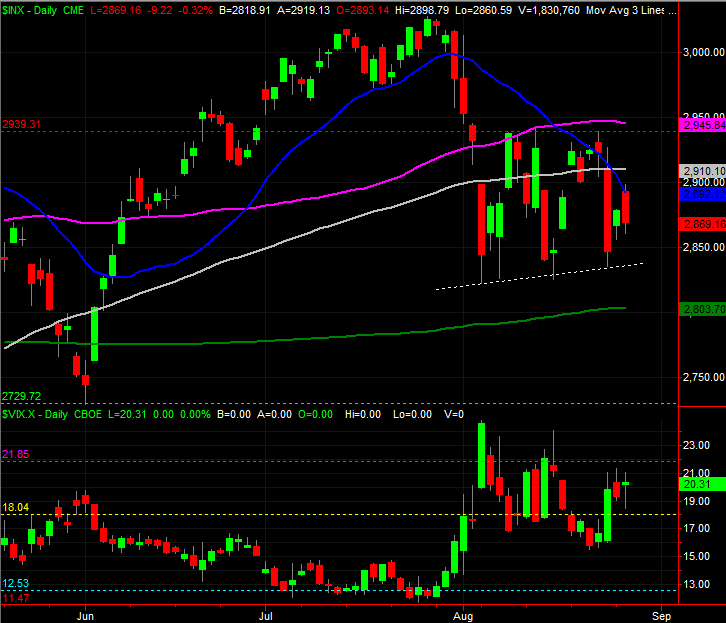
Another potential technical floor - the 200-day moving average line at 2803, marked in green. If the support level near 2836 fails, it's almost a certainty the 200-day moving average line will be tested too.
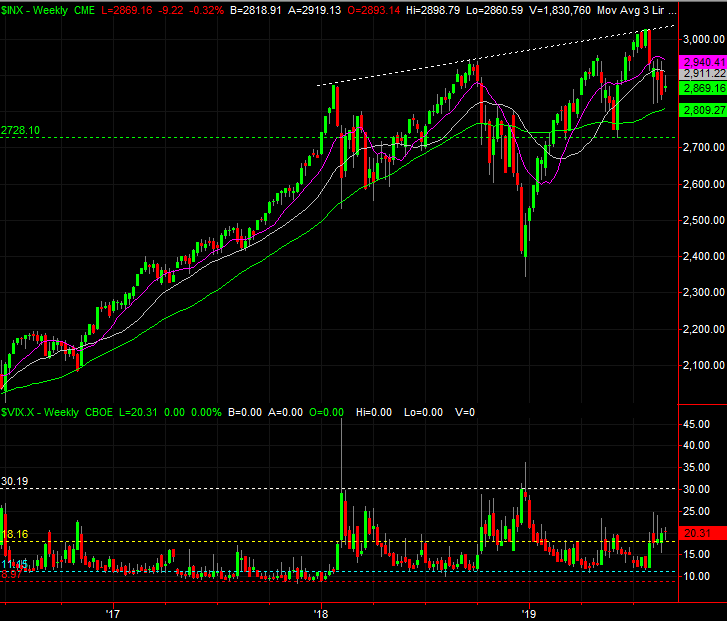
Zooming out to the weekly chart of the S&P 500 makes matters seem more bearish than not, in that the scope of the selloff thus far just isn't that dramatic. We need a more capitulatory move, and a move that ideally would shove the VIX up to the 30-ish area.
There are a couple of major problems with the 'more downside theory at this time, however.
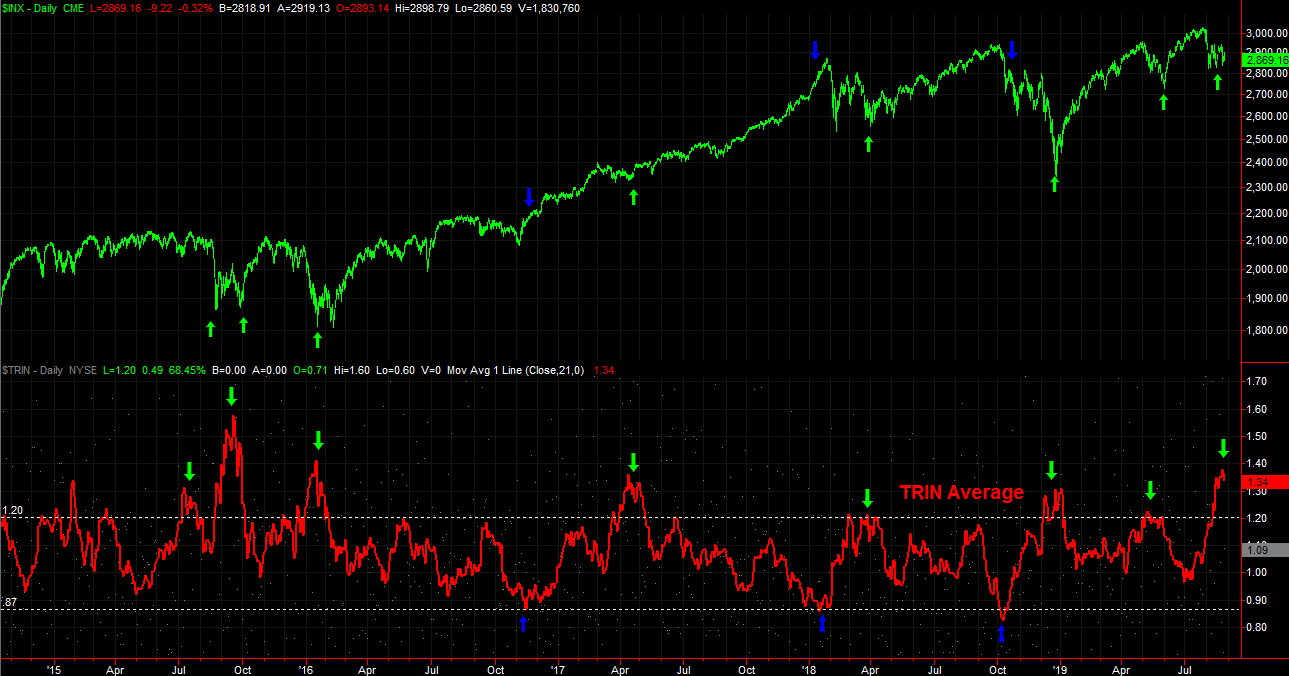
Chief among them is the fact that the TRIN, or Trading Index, is as high as it's been since early 2016.
NYSE TRIN Index
The NYSE's TRIN Index, or Arms Index, is a ratio of the market's advancers and decliners versus a ratio of its bullish and bearish volume. As long as the two ratios remain in balance, no matter how bad or good the market is, it can continue on as such. When there's too much or not enough bearish or bullish volume though, the TRIN reading gets out of whack. If it's too high - like it is now - it's because there's not enough bearish volume compared to the number of decliners. The daily data is too erratic, of course, but it can be smoothed out to something more useful by plotting a moving average of the daily data.
Take a look. Over the course of the past several days, stocks have been falling; the number of daily decliners has been strong. But, that trend's not been adequately backed by 'enough' bearish volume. The sellers don't feel it in earnest yet. Perhaps that won't.
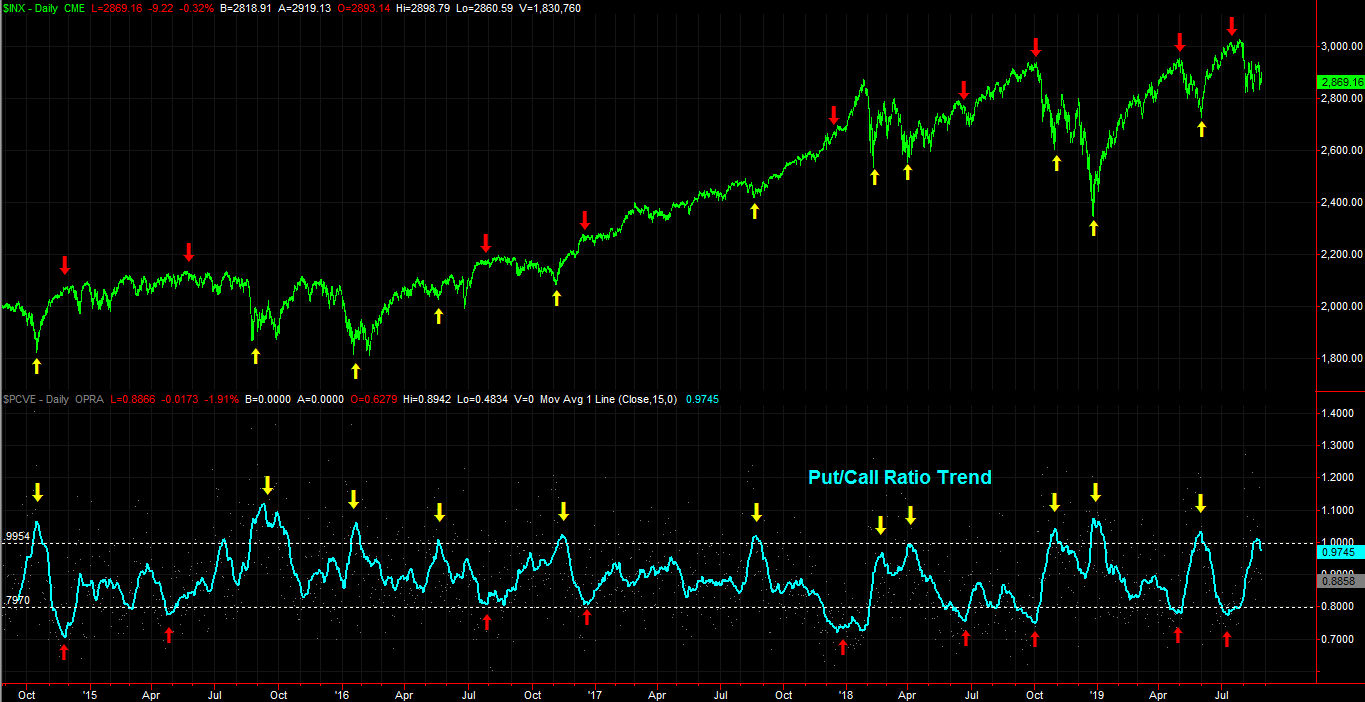
In a similar vein, the put/call ratio trend line is also suggesting the selling has run its course.
Put/Call Ratio
The put/call ratio is not dissimilar to the TRIN reading, or Arms Index, in that it's a comparison of how bullish or bearish traders are really feeling. It just uses a comparison of how many puts they're buying versus how many calls they're buying. When they buy 'too many' puts and not enough calls, something's out of whack.
As of last week, the put/call ratio trend moved all the way above 1.0. That's where the market's made major bottoms for the better part of the past three years.
Between the two, the case for a bullish bounce here is rather strong.
Bottom Line
The problem with the bullish argument is, neither the TRIN reading nor the put/call ratio analysis is laser-precise in terms of timing. There's room and time for stocks to go a little - or even a lot - lower before bouncing back. That 'lower,' though, might just be a move to either of the aforementioned support levels.
The rich irony is, this is all playing out more or less as would be expected, or even scripted. Traders are confused here, which is largely why the indices currently find themselves parked in the middle of lots of support and resistance. Traders are trying to figure it out. It could take some time. More than that though, it could take a little or even a lot more fear to make a good bottom. They're only made when everybody's convinced the market's an outright disaster, and the VIX pops to 30... or ideally, a little more. Again, a setback as small as a slide back to one of the aforementioned technical floors could do the trick.
If the 200-day moving average line fails to find support at the 200-day moving average line though, against the backdrop of another yield curve inversion, all bets are off.
Or, maybe the market is already primed for a bullish move straight away. That would require the S&P 500 to do what it's been unable to do since the beginning of this month though. Stocks may not quite be primed for that yet.
Whatever's in the cards, it's going to become very clear, very soon.