Multiple Trade Signals Drive Option Shark's 50% Gain on Altria

A 50% return is a pretty solid trade by any standard. A 50% return in just two days is exciting to say the least. This wasn't a hypothetical scenario though. Members of our Options Shark trading advisory just scored such a gain. Like most good trades, this one is worth a closer look to see what lessons we can learn - or re-learn - from the setup and eventual outcome. (Great traders do a post-mortem and analysis of all their picks, good and bad.)
The underlying stock was Altria Group (MO)... a name that's been losing more ground than not in recent months, though not without the occasional bounce. If you can find the right entry point into a downside move though, it's a nice stock for some quick gains.
Multiple Trading Tools
We've mentioned the idea before but it bears repeating now: Though you're better served by picking a particular mechanical (chart-based) strategy and sticking with it, you're best-served by applying two or three trading rules that identify the best of the best setups.
And even then, there's an X-factor that can't be ignored; this business isn't completely programmable.
Our Options Shark newsletter uses three technical trading tools above all others. Those are Bollinger bands, the commodity channel index and Price's unique spin on how to utilize the Williams %R tool. Incredibly enough, MO effectively met all three of our trading criteria based on those three tools.
An explanation, however, is still on order for the chart you're about to see.
Bollinger band encapsulate about 95% of a stock or index's treading action. Yet, it's the other 5% of that action that makes for the best trading. Altria shares broke below the lower Bollinger band on the 22nd, prompting the purchase of the February monthly (02/15) 47.5 puts (MO 190215P47.5) at a price of 2.40 each, or $240 per contract. The move below the lower band line, as is often the case, indicated lower lows were on the way.
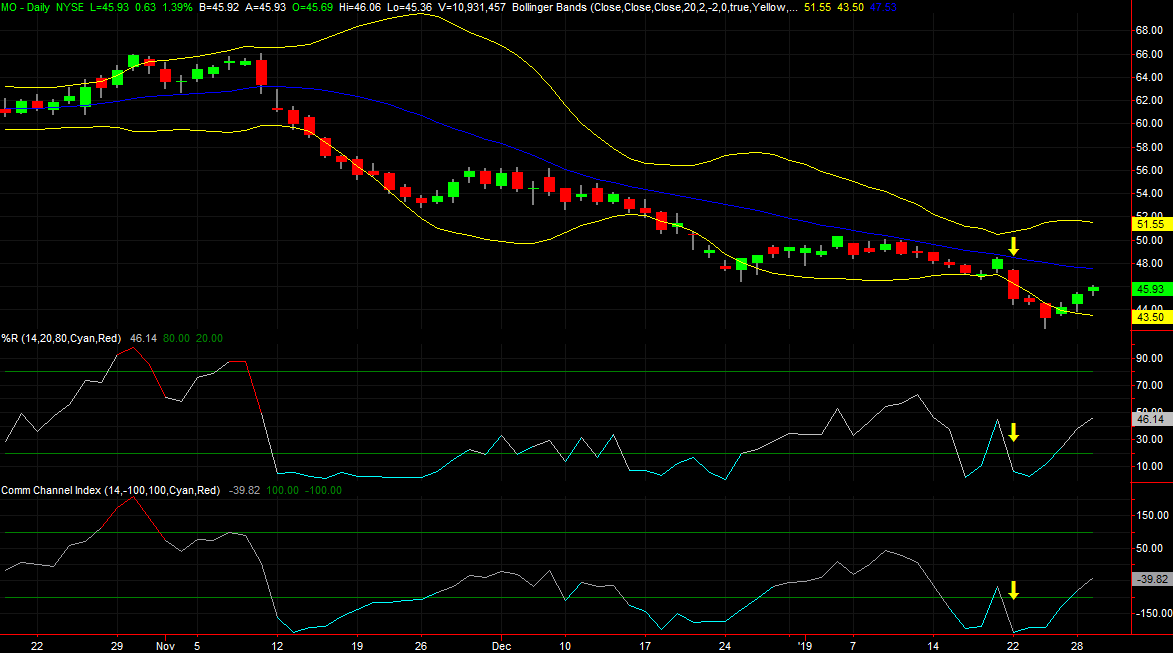
It wasn't just the break below the lower Bollinger band that signaled a trade-worthy drop was in store though. We also got bearish/sell signals from the %R and commodity channel index lines. Those are clues that require some explanation though.
The conventional interpretation of oscillators like CCI and %R lines is that when they reach too low into oversold territory, a bounce is due. Conversely, when they reach too high into overbought territory, a pullback can be expected. We generally agree with the underlying premise. But, Price has noticed a tendency for these two tools. That is, when both of these indicators fall BACK under oversold thresholds, it usually means the downtrend is well-enough developed to expect at least a little more downside. That's exactly what we saw on the 22nd...a move back below the oversold threshold with the stock never actually breaking out of its bearish trend.
It's subtle, but powerful. Those few days in between the re-entry into oversold territory when coupled with a break below the lower Bollinger band line are a pretty reliable setup.
There's still more to the story though.
Get a Qualitative Feel for Stock Charts
Many traders wouldn't have looked, and those who did may not have noticed. But, the week we stepped into those MO puts was also the week that Altria broke back below a falling support line that had tagged all the major lows going back to 2017. It wasn't so much the entry into proverbial uncharted waters that was telling. It was the re-entry that underscored the bearishness brewing at the time... a detail that would have only become clear on the weekly chart.

That wasn't the only X-factor kind of clue that made this trade a must-take kind of setup though.
Take a look at the 20-day moving average line, plotted in blue, on the daily chart. Though it didn't quite touch it on the 21st, it got close. Much like it did the prior two times the 20-day moving average line was approached, the end result was a move to lower lows. Once a trading pattern is established, it often repeats itself. The repeat here was enough to push the value of the February 47.5 puts to $3.60 a couple of days later, when we stepped out and locked in the gain.
The Take-Away
In some ways it's simple. In other ways it's complicated. In all ways though, this particular trade required some quantitative and qualitative thought. Most of the best ones do.
More than anything though, recognize that we considered multiple factors before placing the trade. That's often the key, and even more so in a choppy, uncertain environment like the one we're in now.
If you'd like to learn more about option trading by doing them, the Options Shark service is a great way of doing so. Capital requirements are modest, and the strategies used don't keep money tied up for more than a few days at a time. Go here to learn more.