Chart School: Big FANG Trade Win Shows Power of Rarely Used DMI Tool
Earlier this month the FANG Options Trading Advisory scored a big, and quick, win on some Facebook (FB) calls. Specifically, on the 14th we paid $9.45 for some Facebook June monthly (06/21) 172.5 calls (FB 190621C172.5), and were able to sell those calls on Monday the 17th - the next trading day - at $16.68 per contract. That's a 77% score in a (very) short amount of time.
While nice lick for our portfolio, what's most interesting about the short-term trade was what prompted it. It makes for a great object-based lesson about one of relatively underused trading tools we specifically employ for the FANG trading service.
It's called the Directional Movement Index, or DMI for short. In simplest terms, the DMI indicator plots the day-to-day movement in a stock's (or index's) highs, and separately plots the day-to-day changes in that chart's lows. While the closing price is important, there's a lot of value in the highs and lows over time as well.
The value is in the comparison of the two pieces of information. That is to say, by overlaying the DMI+ line, which tracks the trend of the highs, with the DMI- line that illustrates how the lows are changing over time, you can spot a tipping point of sorts. When one crosses the other, it often serves as a great buying or selling trigger.
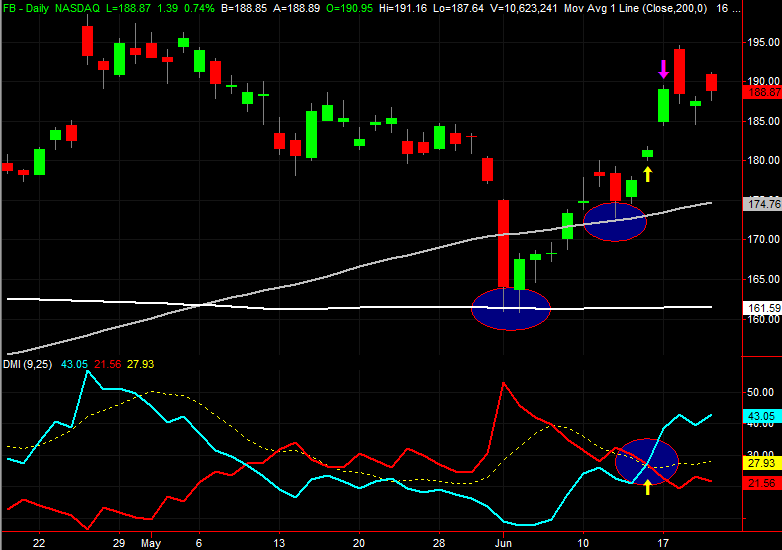
Facebook's DMI lines are plotted on the bottom of the graphic below, though a word of warning... the DMI lines you see and the parameters or lengths you see marked on the chart aren't the exact same DMI lines we utilize. Ours our custom-built with an important proprietary tweak, and our length (or bars used to calculate the DMI value changes from day to day) isn't twelve. Still, it's enough to make the point and illustrate the power of the Directional Movement Index lines.
The DMI+ line is plotted in blue, while the DMI- line is marked in red. The crossover from the 14th (highlighted) is a key reason we stepped in then... though it's not the only reason. (The yellow ADX line is another DMI component we won't get into right now.)
The other reasons we pulled the trigger on this trade? There are two of them, actually, although they're certainly related. Early in the month the white 200-day moving average line acted as a huge technical floor, and on the 13th the gray 100-day moving average line was kissed and rekindled the fresh uptrend. The momentum had been established; the bulls were going to use any excuse they could to buy on even the smallest of dips.
It was a bit of a risky trade that same options traders would have passed up. The opening gap from the morning of the 14th set the stage for a pullback, as the market generally doesn't like to leave gaps unfilled.
This was more than a justifiable risk though, as the momentum had already been established. Shares were being catapulted, making the gap at that time a bit irrelevant.
It also has to be said that, a willingness to go long after Facebook logged a bullish gap is one of the benefits of a hyper-tight focus on only a handful of names. We know FB is no stranger to gaps, most of which do get filled in, but very few of which are closed right away. In other words, by constantly watching Facebook and building trading algorithms just for a very tiny subset of the market, it's fairly easy to be an expert on how Facebook moves. We capitalized on that knowledge and experience just a few days ago, and reaped the reward for it.
We're still huge fans of using technical tools like DMI lines though, when they've been proven with backtests. This sort of mechanically minded approach takes the often-misleading emotional aspect out of the equation.
In any case, the big take-away for traders as to point them toward a largely overlooked DMI indicator, though with a caution that the default setting for most DMI lines aren't all that great. You'll want to experiment with more meaningful timeframes and lengths. For more on the Directional Movement Index tool, check this explanation out.
The other big take-away is something we frequently note... get a second opinion. In this, the bullish stage had already been set by clear support at two monumentally important moving average lines.
If you'd like to simplify and accelerate your trading by narrowing your focus on just a few stocks, the BigTrends FANG Options Advisory is for you. It dishes out about eight trades per month, and only holds these positions for roughly one to three days. It's a great way to get the most out of the market's biggest movers and not waste time or capital on less active stocks. Go here to learn more.