Using Directional Movement Index (DMI) Technical Analysis Chart Indicator
Directional Movement Index (DMI)
The Directional Movement Index, or DMI, is a moving average of range expansion during a specified period of time. In other words, it indicates how strong a trend is by looking at how significant price changes have been in a specified period of time. But, unlike most technical momentum indicators, directional movement index lines aren’t plotted based on a stock or index’s closing price. Rather, they’re plotted based on the bar-to-bar changes in a security’s highs or lows.
The DMI indicator is actually a two-plot indicator….the +DMI line, which tracks the size of the bar-to-bar changes in a security’s highs, and the -DMI line, which tracks the size of the bar-to-bar changes in a security’s lows. The +DMI and -DMI lines are plotted on the same plane (starting at zero, and theoretically extending infinitely higher, but usually capped between 40 or 50), and often compared to one another as a means of deriving buy and sell signals from the directional movement index indicator.
The directional movement index plots aren’t difficult to interpret once understood, but there is one potentially confusing nuance with them. That is, when the bull trend is strong, the +DMI line is rising and the -DMI line (usually) falls. Conversely, when a bearish trend is strong, the -DMI line rises and the +DMI line (also usually) falls. For that reason, it’s critical to know which line is which when interpreting a DMI chart. This is usually accomplished by using different colors to plot the -DMI and +DMI lines.
An example will clarify how each directional movement index line moves in relation to bullish or bearish trends.
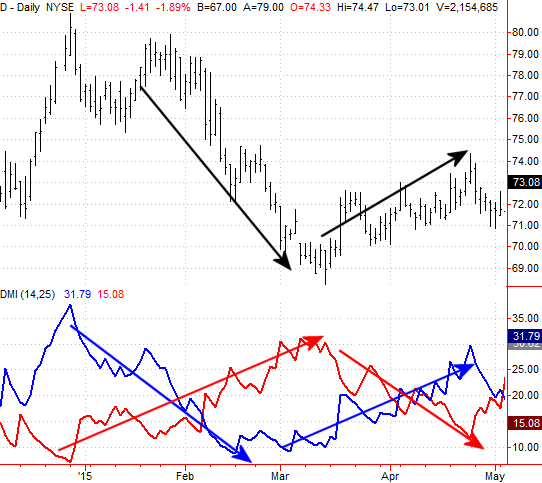
On the image below, the +DMI line is plotted in blue, and the -DMI line is plotted in red. The former rises when the trend is bullish and falls when the trend is bearish. Conversely, the -DMI line points higher when the trend is bearish, and moves lower when the trend is bullish.
D Daily Chart with DMI
As for using the directional movement index indicator to generate buy and sell signals, crosses of the +DMI and -DMI line are one way of doing so. But, that’s not the only way; some technical analysts argue that such a methodology is too lagging in nature… meaning it doesn’t create a signal until well after the trend has started. As an alternative, some technicians use higher highs made by the -DMI or +DMI lines as a sell or buy signal, respectively.
Whatever approach is chosen, traders should test it for accuracy and use those signals consistently when using the directional movement index indicator as a trading tool.