Weekly Market Outlook - Toying With Technical Support, Part Deux
As has been the case more than a few times this year, just when it looks like the market's finally going to fall off the edge of the cliff, the bulls find a way to bring it back from the brink. After toying with multi-week lows on Thursday last week, the buyers stepped up to the plate on Friday.
Still, some damage was done. The NASDAQ Composite as well as the S&P 500 both ended the week beneath come key support levels, and putting a fair amount of pressure on other key technical floors. We're still within short reach of a break below key support levels though could allow the selling floodgates to open.
We'll weigh it all below, but first, let's run down last week's economic news and preview this week's announcements. Traders are still looking for cues as to what they're supposed to do next, and they're paying a little more attention to these details than they normally might.
Economic Data
There's no point in not starting the discussion within anything other than last week's big Kahuna... June's employment report, posted on Friday. Though the unemployment rate ticked up from 4.3% to 4.4%, we added a lot more jobs that had initially been implied by Wednesday's ADP payroll report. In total, the nation added 222,000 new jobs last month, pushing the total number of working people up to a record 153.168 million. The number of people not in the labor force but still wanting a job fell to a multi-year low of 5.431 million.
Unemployment Rate, Payroll Growth Charts
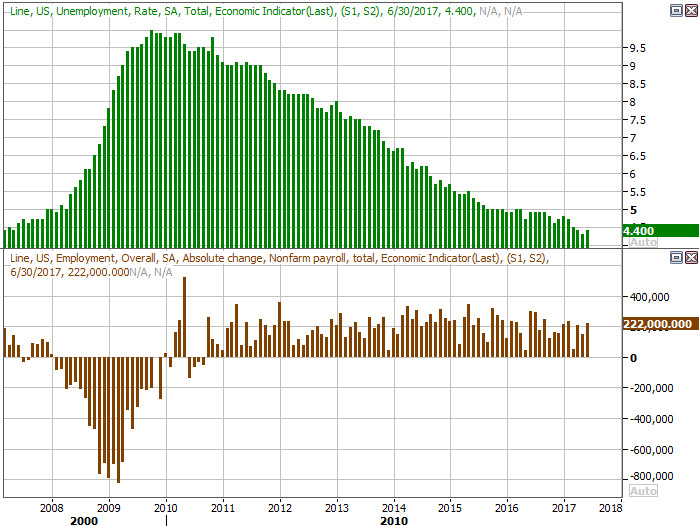
Source: Thomson Reuters
As for how the slight rise in the unemployment rate can be a good thing, we covered that in depth at the website.
The employment snapshot wasn't the only item of interest last week though. We also heard about both the ISM Services and ISM Manufacturing Indices. Both were not only up for the month, but up more than expected. Neither is in decisive forward-progress mode yet, but each one is in a position to break out of a rut.
ISM Index Charts
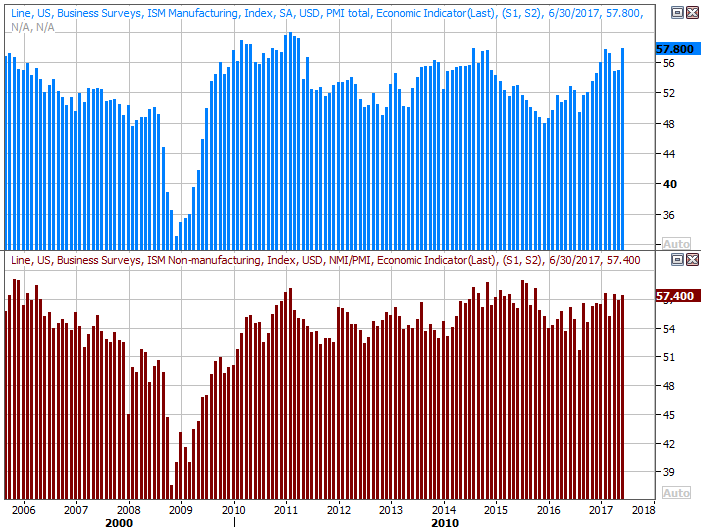
Source: Thomson Reuters
In conjunction with all the other progressive economic data we're seeing, the expanding ISM scores can be taken at face value.
As we've been saying, we normally don't care about the weekly report of the nation's stockpiled oil. But, in light of oil's recent and not-so-recent roller coaster ride -- and since this seems to be the date point most of the market wants to obsess over -- we'll look at it. And, it's good news. After stalling for a bit in late May and June, the downtrend of the country's stored oil fell in a pretty big way, to a multi-week low of 502.914 million barrels.
Crude Oil Inventory Charts
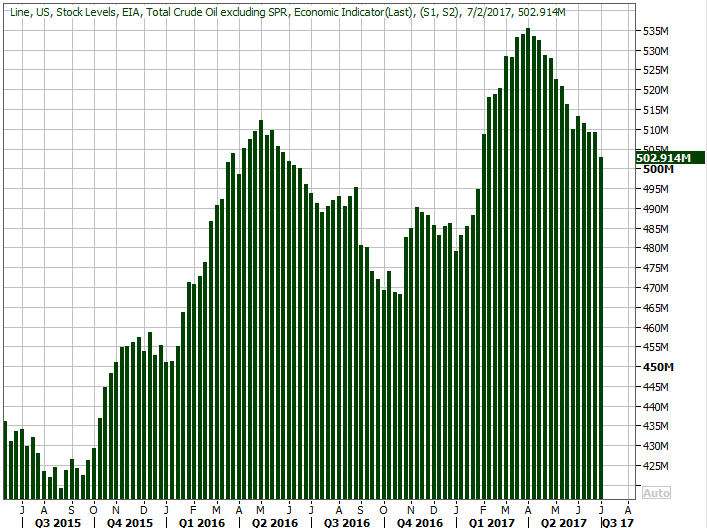
Source: Thomson Reuters
That's still at glut levels, and unfortunately, didn't do a whole lot to boost oil prices. The dollar's action isn't helping, and the fact that the U.S. is exporting more oil than ever before suggests that inventory is simply going somewhere else rather than being whittled down. Still, this drawdown is a step in the right direction for crude prices.
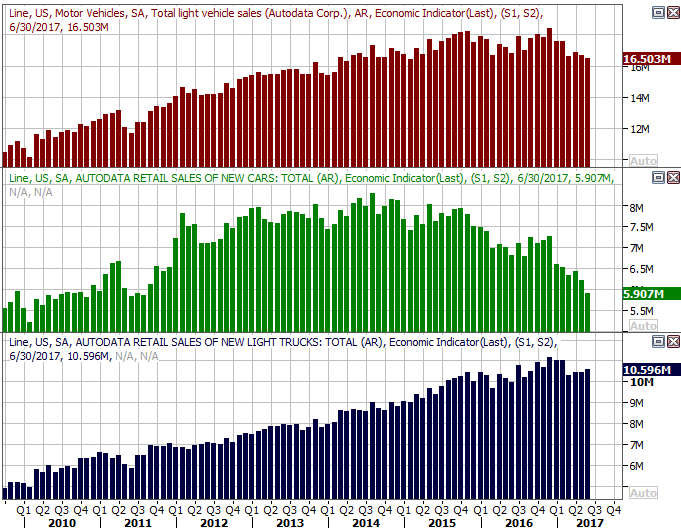
Last but not least, though it wasn't a big surprise, June's auto sales were lackluster, extending what's become a long-term downtrend. As it stands right now, the annualized auto sales rate stands at 16.5 million vehicles. Sales of passenger cars plummeted, and while sales of trucks moved a little higher -- sequentially -- for a third month in a row, we're still not seeing net growth there anymore.
Auto Sales Charts
Source: Thomson Reuters
Everything else is on the grid.
Economic Calendar
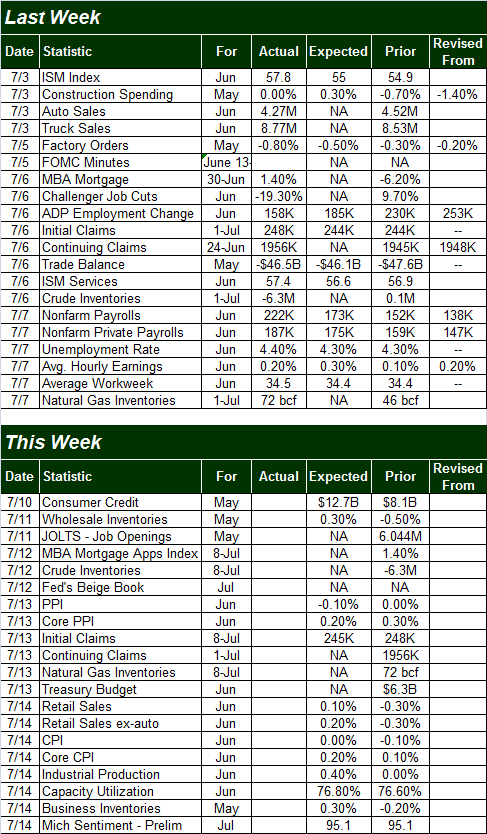
Source: Briefing.com
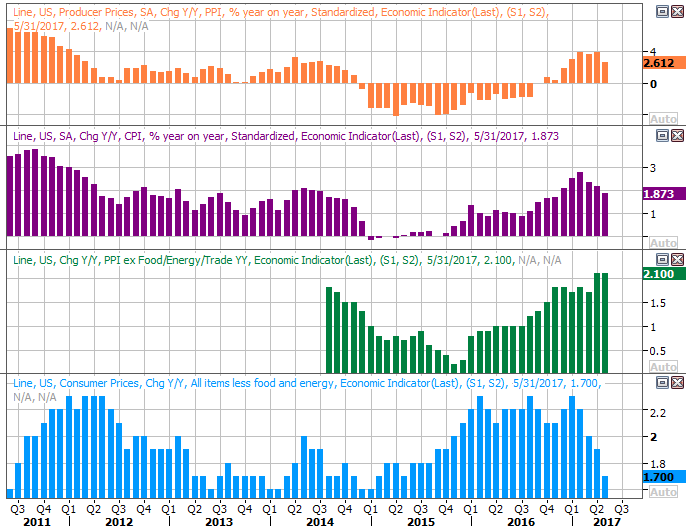
This week is going be almost as busy, though nothing hard-hitting comes until later in the week. The party won't get started in earnest until Thursday's producer inflation report, which is followed by Friday's consumer inflation report. You can see most inflationary measures have been dwindling, but don't confuse that with deflation. It's more an indication of stabilizing, as the recent-past year-over-year comparisons were highly unusual thanks to crude oil's 2014 implosion. That said, if overall inflation remains at or under 2.0%, the Fed doesn't need to be in a big hurry to impose its next interest rate hikes.
Producer and Consumer Inflation Charts
Source: Thomson Reuters
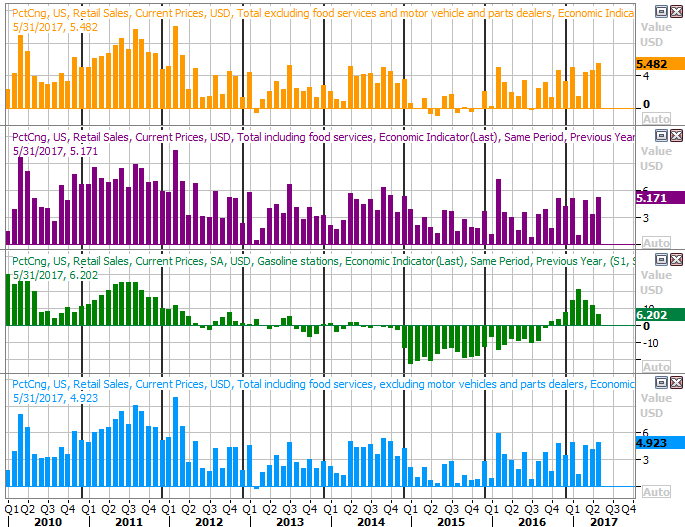
On Friday we'll hear June's retail sales figures. Economists are looking for decent forward progress, reversing May's surprise sequential lull in spending. Just note that on the more relevant year-over-year basis, consumers are spending as briskly as they have in years. In fact, the trend appears to be accelerating.
Retail Spending Growth (YOY) Charts
Source: Thomson Reuters
Finally, also on Friday we'll get last month's industrial productivity and capacity utilization charts. Analysts are looking for a little forward progress on both fronts, which we need. And, in light of the strong upward follow-through we've seen of late from both measures, odds are good we'll meet or exceed those outlooks.
Industrial Productivity and Capacity Utilization Charts

Source: Thomson Reuters
Though it goes mostly ignored, the capacity utilization and industrial productivity has one of the highest correlations with the broad market's earnings. To see both on the rise bodes well for bottom lines.
Index Analysis
The market may have finished last week on a bullish note, but it also closed the week out just a hair better than it finished it, and within easy reach of moving under key support.
This is readily evident on the daily chart of the S&P 500. Falling for two weeks after peaking on June 19th, the index moved to a close below the 50-day moving average line (purple) on Thursday. The bulls stepped back in on Friday to set up a weekly close above the 50-day moving average on Friday, but one day doesn't make or break a trend. In fact, look at the volume for Friday.... there wasn't a lot of participation for that rally.
S&P 500 Daily Chart
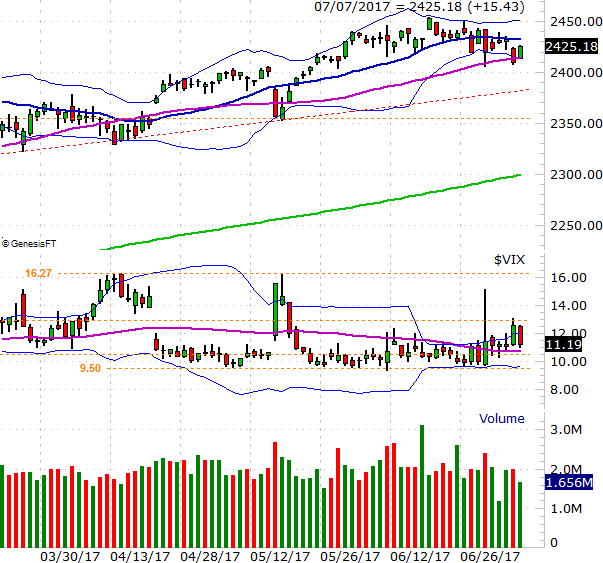
Chart created with TradeNavigator
Zooming out to a weekly chart of the S&P 500 gives us a lot more perspective on where things are, and why we don't need to worry too much just yet. In this timeframe we can see a much bigger technical floor around 2391 (red, dashed) is still intact. It's also in this timeframe we can see the VIX's converging wedge hasn't been broken yet. Until that upper boundary is cracked, the uptrend is still technically intact... and any weakness is just a lull.
S&P 500 Weekly Chart
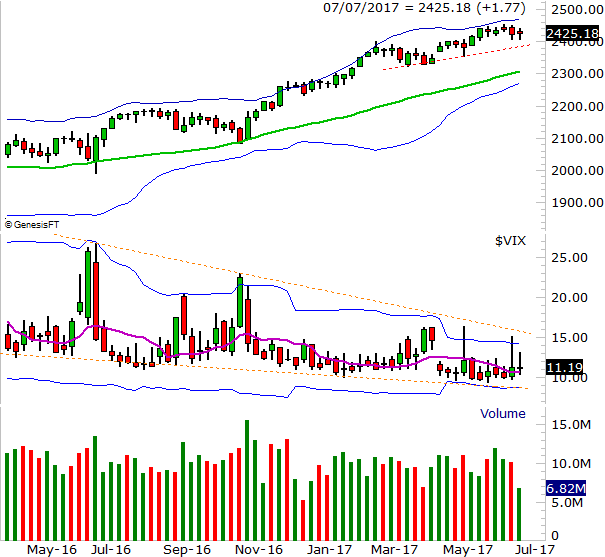
Chart created with TradeNavigator
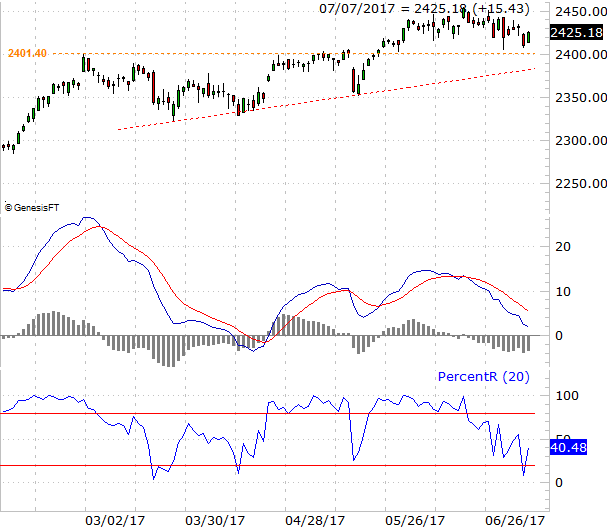
With that as the backdrop, let's go back to a daily chart of the S&P 500 to look at what will more or less clinch the idea that a small pullback is turning into a bigger pullback. That is, the daily chart's two MACD lines should both be below zero, and the PercentR line should fall back under the 20 threshold at the same time the S&P 500 moves to a new low. It's very likely by that time the S&P 500 would be below the aforementioned 2391 level.
S&P 500 Daily Chart, with PercentR and MACD Lines
Chart created with TradeNavigator
Of course, if the S&P 500 manages to pop back above its 20-day line at 2432 before breaking down, the bearish scenario becomes moot. You don't want to jump the gun here.