Weekly Market Outlook - D-Day is Coming Soon... Maybe This Week

Last week's loss was modest in the sense that it was small, and didn't drag the indices below any key support levels. On the other hand, it was significant in the sense that the indices -- despite trying -- failed to hurdle a key ceiling. As such, we're still on the fence, but the market is apt to move decidedly off it sometime this week.
We'll look at the way support and resistance is squeezing in on the indices in a moment. The first thing we want to do, however, is take a closer look at last week's economic news, and set the stage for this week's economic announcements.
Economic Data
There's no denying it... last week's biggest news was also the grand finale. On Friday, the Department of Labor unveiled March's employment report. It was a confusing event.
On Wednesday of last week, payroll processor ADP suggested we were on for a pleasant surprise, reporting 263,000 new payrolls versus expectations of only 245,000 new jobs. The DOL didn't follow suit on Friday, telling us it only counted 98,000 new jobs compared to expectations of 180,000. Yet, the unemployment rate trickled down from 4.7% to 4.5%... a new multi-year low.
Unemployment Rate and Payroll Growth Charts
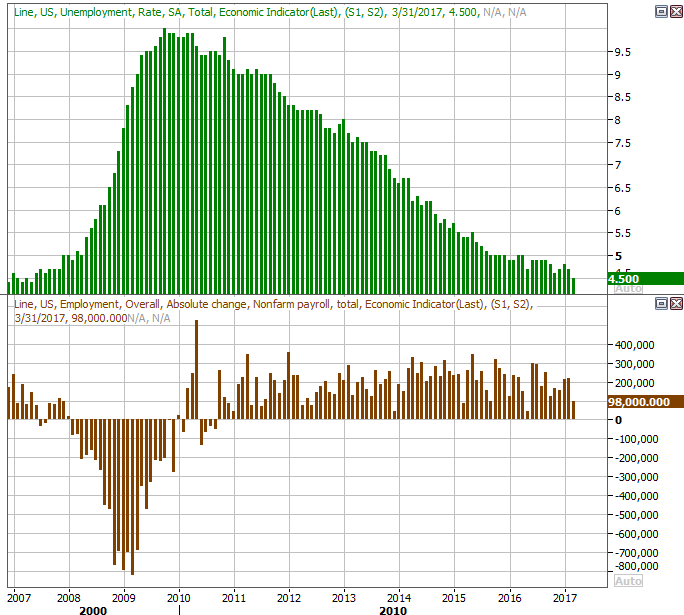
Source: Thomson Reuters
It's a glass half-full/half-empty scenario. While we'd like to see better job growth, with the unemployment rate at 4.5% we're already (arguably) at maximum employment. The only meaningful improvement we're going to see form here will be in terms of higher wages, meaning employers are being forced to pay more competitively to hire and retain workers. We looked at the matter in detail at the website on Friday.
Last month's employment news wasn't the only economic data we got. It was also a big week for ISM numbers, with the manufacturing version of the report coming on Monday, and the services figures being unveiled on Wednesday. Both rolled in above the key 50 level again, but both also fell from February's levels.
ISM Indices Charts
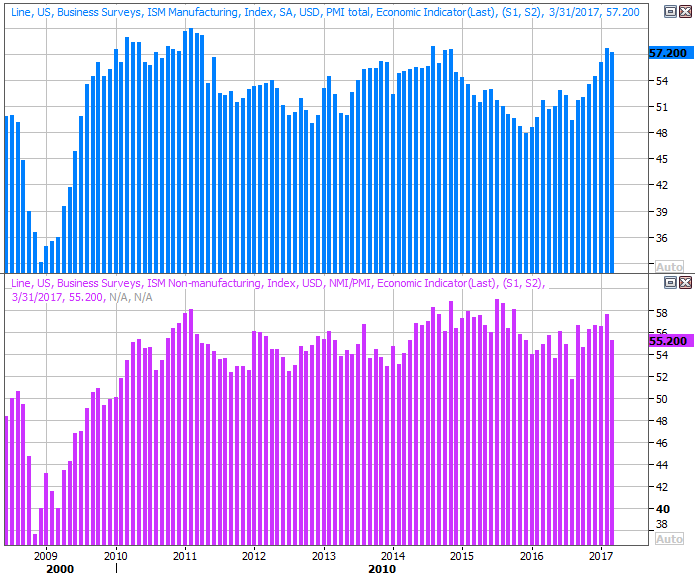
Source: Thomson Reuters
We'd like to see each score continue to rise, and both are indeed still in bigger-picture uptrends. Last month's lull isn't nearly enough to put us into a panic.
Finally, on Monday of last week we heard sales reports from all the major manufacturers with a meaningful presence in the United States. With the exception of GM, they weren't good (and even GM fell short of its anticipated growth).
Auto Sales Charts
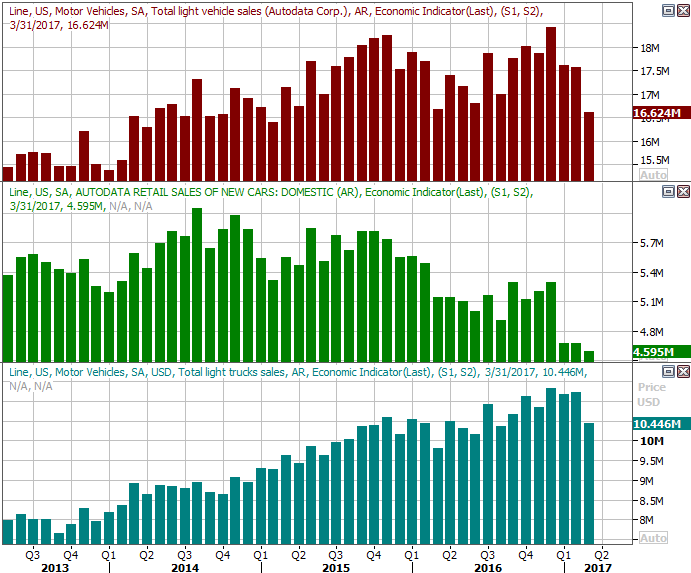
Source: Thomson Reuters
One month doesn't make a trend, and there were some bright spots. For instance, sales incentives actually fell a bit from February's high levels, implying demand isn't alarmingly soft. Still, the notion of 'peak auto' lingers, and understandably so... especially now that truck sales are struggling.
Everything else is on the grid.
Economic Calendar
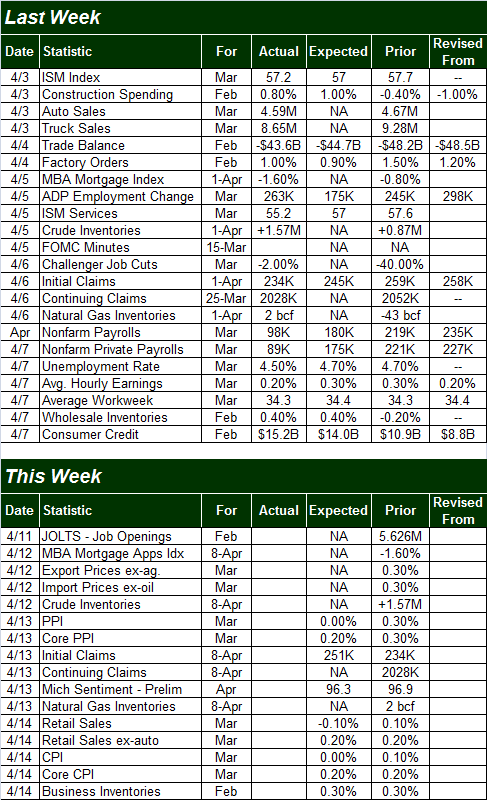
Source: Briefing.com
This week isn't going to be quite as busy, but we are getting some big items. One of the biggies is last month's inflation -- producer and consumer. Both have been rising at a brisk clip, though that pace is expected to have slowed down a bit last month. The Fed's rate hike may have had something to do with that, but market forces are starting to kick in a bit as well. Still, the Federal Reserve has room and reason to keep pushing back against inflation.
Producer and Consumer Inflation Charts
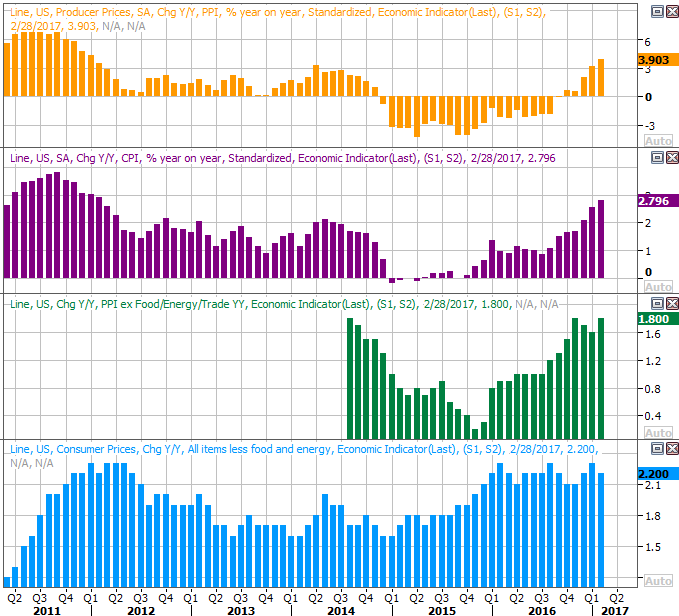
Source: Thomson Reuters
The producer price inflation numbers will be posted on Wednesday, with consumer inflation numbers on Thursday.
Also on Thursday we'll get last month's retail sales figures for March. Economists are looking for a decent 0.2% advance not counting cars, but with cars, the overall figure is expected to fall 0.1%. Either way, though doubts about the economy have been lingering for a while now, consumers have certainly done their part to keep things going.
Retail Sales Year-Over-Year Growth Charts
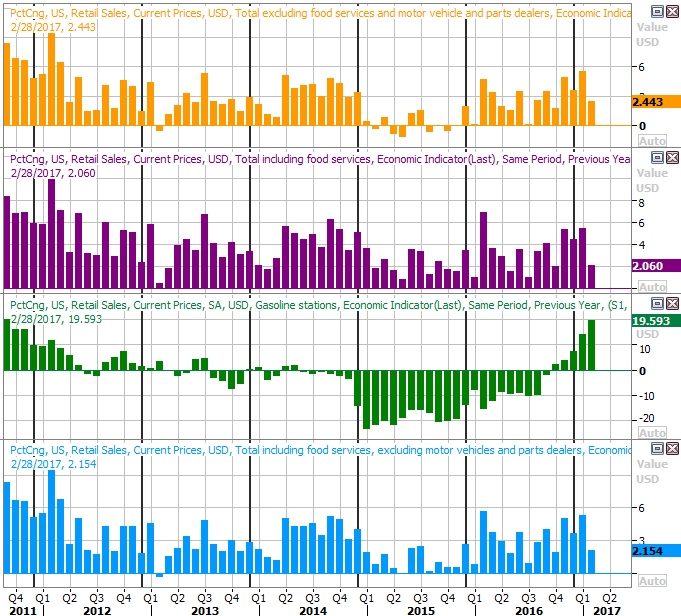
Source: Thomson Reuters
Index Analysis
Perhaps the one thing worse than a market that isn't rallying at all is a market that tried to rally, and then failed to follow through.
That's exactly what happened on Wednesday. The S&P 500 managed to punch past the 20-day moving average line (blue) and push past a technical ceiling at 2371... but only for a while. That effort was completely up-ended by the end of that day, and though the bulls tested the waters of a breakout on Thursday and Friday, they never got any real traction.
S&P 500 Daily Chart
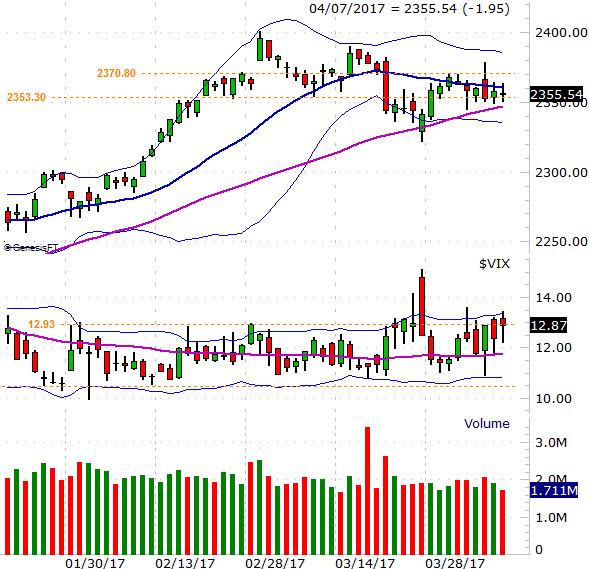
Chart created with TradeNavigator
The market's still holding on, even if only by a thread. That is to say, the S&P 500 remains above the pivotal 50-day moving average line (purple), and within reach of a break above 2371. Something happened last week, however, that should be very alarming to the blindly bullish - the VIX has finally started to trend upward, tiptoeing into territory above the 12.9 mark. This is the second time since mid-March we've seen this happen, but this time the upward move is unfurling at a sustainable pace.
Zooming out to the weekly chart of the S&P 500 doesn't tell us anything new, but it does underscore the idea that there's a subtle shift in the market's undertow.
S&P 500 Weekly Chart
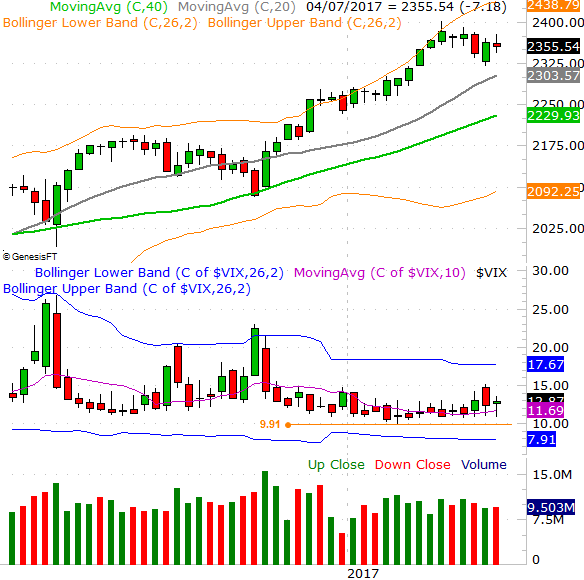
Chart created with TradeNavigator
Still, assume nothing. The market has made a point of doing the unexpected of late, and though we're due for a dip, there's certainly no guarantee something politically (or earnings) driven won't reignite the bullish flames so many investors are intent on stoking.
On the other hand, if the past is any indication -- and it is -- we do have a pretty good idea of how far a correction may go. The 200-day moving average line (green) currently at 2230 has been a floor a couple of times in the past year, and the VIX has found a ceiling at the upper Bollinger band at prior major bottoms... when the S&P 500 found a floor at the 200-day moving average line.
That's not necessarily a call for a major pullback right here and right now, but if here and now is the time and place, that's most likely what it would look like.
There's a reason we're not holding our breath waiting on more of a pullback. That is, the market has been this bullish before, and managed to keep on trucking.
The day-by-day performance chart (one-year) of the S&P 500 below makes this point well enough. While the index is well above the average year-to-date performance right now, it's only right at the typical bullish year' a bullish year just means that year ended with a gain. It started out 2017 a little too hot, but the recent lull has reeled it in to the normal bullish year.
S&P 500 Annual Performance Path (Bullish, Average, Bearish, YTD) Chart
Chart created with TradeNavigator
So, as was said, though we may be deserving of a corrective move, we don't have to necessarily suffer one right now. One thing is for sure either way though. That is, the market is going to have to decide to break above resistance or break under support very soon, as there's less and less room to maneuver.