Despite Tuesday's Tumble, Stocks Are Still in the Hunt.... Although...
Meh. In the grand scheme of things, Tuesday could have been worse. The S&P 500 ended up losing 1.16% of its value, and broke under some fairly important support levels. But, it was pushing up and off of its low before the day's close, and the volume behind the selling - though not modest - wasn't exactly devastating either.
It's times like these, however, we need to remember that reversals are more of a process and less of an event. That's the long way of saying we really don't know anything yet, and shouldn't jump to conclusions.
The bad news: The S&P 500 tumbled below its 100-day moving average line (gray) on Tuesday... the line we were touting as a floor in this weekend's Weekly Market Outlook. Turmoil in Italy was the prod, though truth be told, the bears were waiting on an excuse - any excuse - to take some profits.

The good news: The S&P 500 is still above its 50-day moving average line (purple), and Tuesday's selloff may have actually been beneficial to the bulls in the sense that it relieved some pent-up pressure from an overbought and tense market. If the bulls can make good on Tuesday's late rebound effort, this just might serve as the foundation for a more prolonged rally.
That's a huge 'if' though.
The key thing to bear in mind here, as was noted, is that it could take some time for the market to make a decision. The bulls and the bears are going to do battle now, and while each will win a few skirmishes, but the winner of the proverbial war is still in question. There are some red flags, however, that actually point to bearishness ahead.
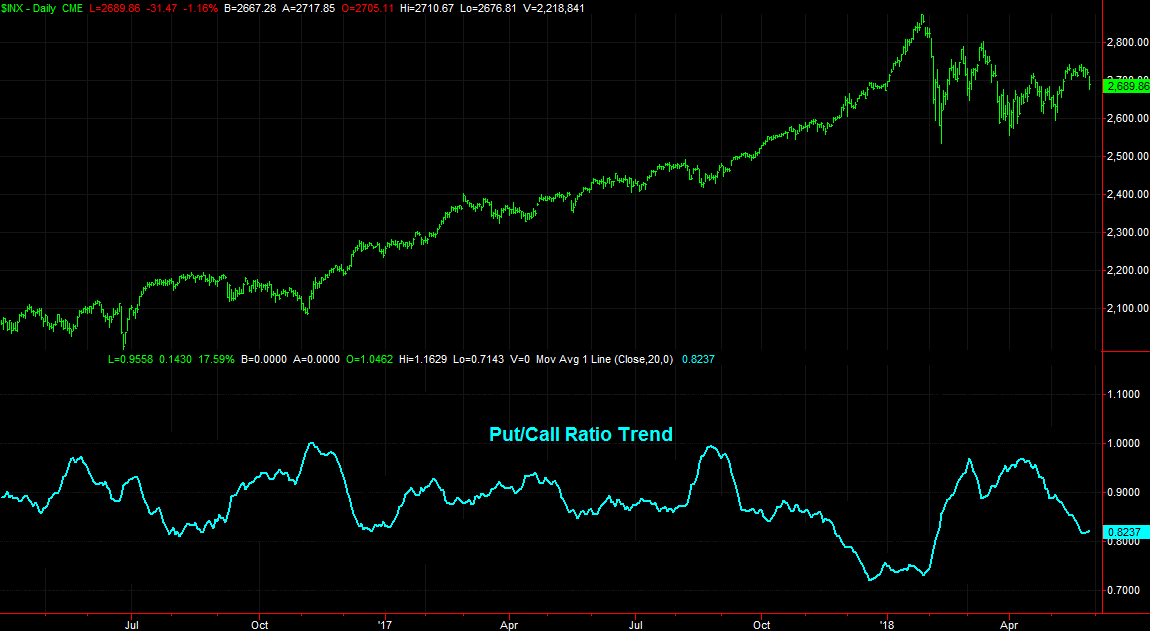
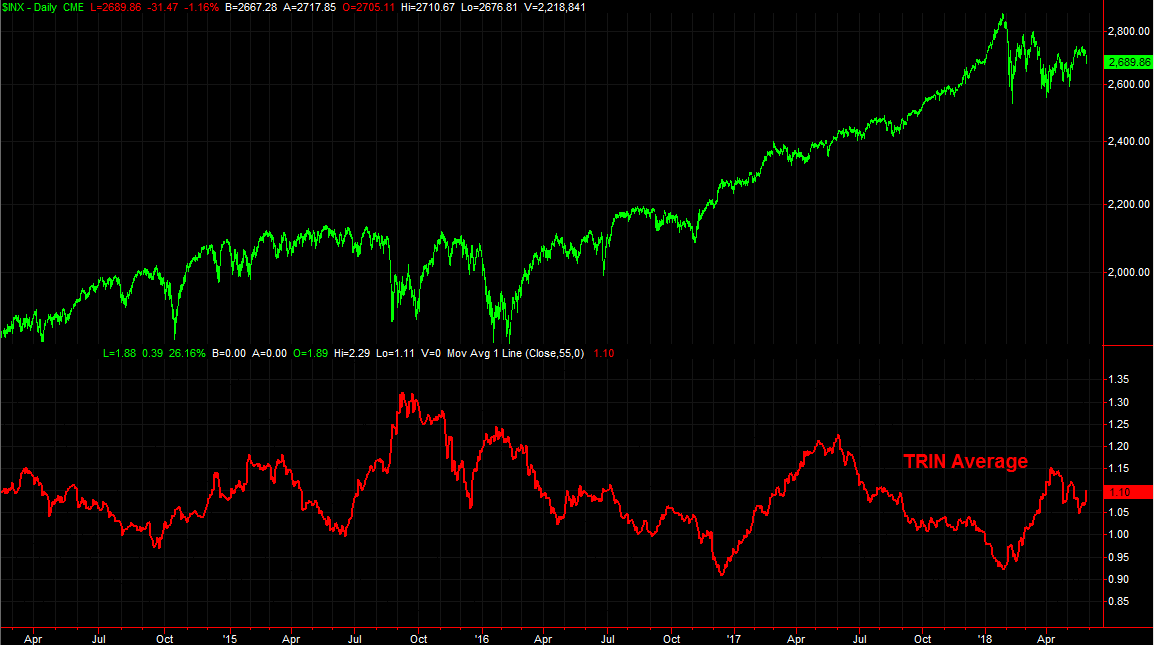
We don't talk about them very often, mainly because there's no need to. But, we're seeing bearish undertows from the TRIN Index, or Arms Index, and the put/call ratio.
We've looked at both in detail before, so we don't want to belabor the point now. We'll just highlight the fact that an Arms Index that's trending higher tends to coincide with a weak or even bearish market, while a put/call ratio trend that's rising also tends to coincide with a weak or bearish market. And, vice versa in both cases.
To that end, the moving average of the Arms Index, or TRIN, appears to be edging higher again now after peeling back again since April.
And, though 'just barely,' the put/call ratio's moving average appears to have stopped falling, and is testing the waters of an upward move again.
The upside of both of these indicators is (ironically) also their downside. That is, they're non-descript and non-definitive. They can show us interesting things about a market. Namely, they can show us what traders are quietly doing in the background that may not be obvious, but can dictate where a market ultimately goes. But, they don't tell us which direction the market's momentum is pointed; sometimes traders are wrong to do what they're quietly doing in the background. You also don't need anyone to point out that neither tool is perfect.
More often than not though, the put/call ratio and the TRIN trend can confirm what we're already suspecting. In this case, that bodes poorly for a market that's suddenly under pressure again.
Again, we can't stress enough it could take a few days for the market to find its true bearings. And, it can never hurt to prepare for all possibilities. It also can't hurt to decide ahead of time that the bigger-picture trend is still bullish even though we all innately know stocks are still overbought and overvalued in the short run. That's what the Arms Index and put/call ratio are telling us anyway.
Just don't read too much into those hints. Any major selloff - which is plenty likely around this time of year - is still a strong buying opportunity for investors that see and think more than a week into the future.
As for the S&P 500 in the meantime, the absolute floor is still at the 200-day moving average line (green) at 2635, and it would take a move above last week's high around 2742 to convincingly say the risk trade is 'back on.' Any gyrations between those two levels is just the bulls and the bears playing chicken. None of that action can be taken too seriously.
We stress again... a break below the 200-day moving average line could really inflict trouble, though it would ultimately serve as a buying opportunity. We'd be buyers after such a setback of and when the VIX moves to above 40, or when the TRIN reading moves to 1.2-ish, or when the put/call trend reaches the 1.0-ish area.
Almost needless to say, stay tuned. The next few days could be quite interesting. And, if history and other subtle clues are any indication, we could be headed into a sizeable setback. [We kind of hope we are though, for a lot of reasons.] We'll see.