The Arms Index Says This is the Least-Enthusiastic Rally in Years
The headlines of late have been even more binary than usual. That is to say, half of traders and commentators are extremely bullish, while the other half are alarmingly bearish; there aren't too many people in the middle.
Each camp has plenty of evidence in support of their argument too.
Well, here's a piece of evidence you can add to the "bearish" ledger, and it's unlikely you'll have heard about it yet despite its solid track record (a track record that's at least as reliable as all the other tools -- most of them sentiment -- over the course of the past month or so).
Ever heard of the Arms Index? Sometimes it's called TRIN, which is the shortened form of Trading Index. In simplest terms, it's a ratio of ratios, comparing an exchange's advance-decline ratio to its advance-decline volume ratio. The specific formula: Arms Index = (advances / declines) / (advancing volume / declining volume).
The idea is to determine whether or not a rally or a selloff is balanced. In other words, if the Arms Index or TRIN reading is 1.0, the amount of bearish volume for a selloff is appropriately matched by the number of stocks that are falling on any given day. Or, for a rally, it can mean the number of stocks that are moving higher on any given day jibes with the bullish volume for that day. The Arms Index can be calculated for any exchange, and also for some of the major market indices. The most common one though (and the one we'll use today) is the NYSE's Arms Index.
The day-to-day TRIN data is too erratic to use. To smooth out the volatility and turn the data into something that can actually be analyzed, we look at moving averages of the daily TRIN data. The length of the moving average can be short-term or long-term, depending on your intended trading timeframe. For today's look, we're focusing on a long-term moving average -- the 55-day moving average -- which means this particular viewpoint is something we want to consider for trades that we intend to hold on the order of months, if not for more than a year.
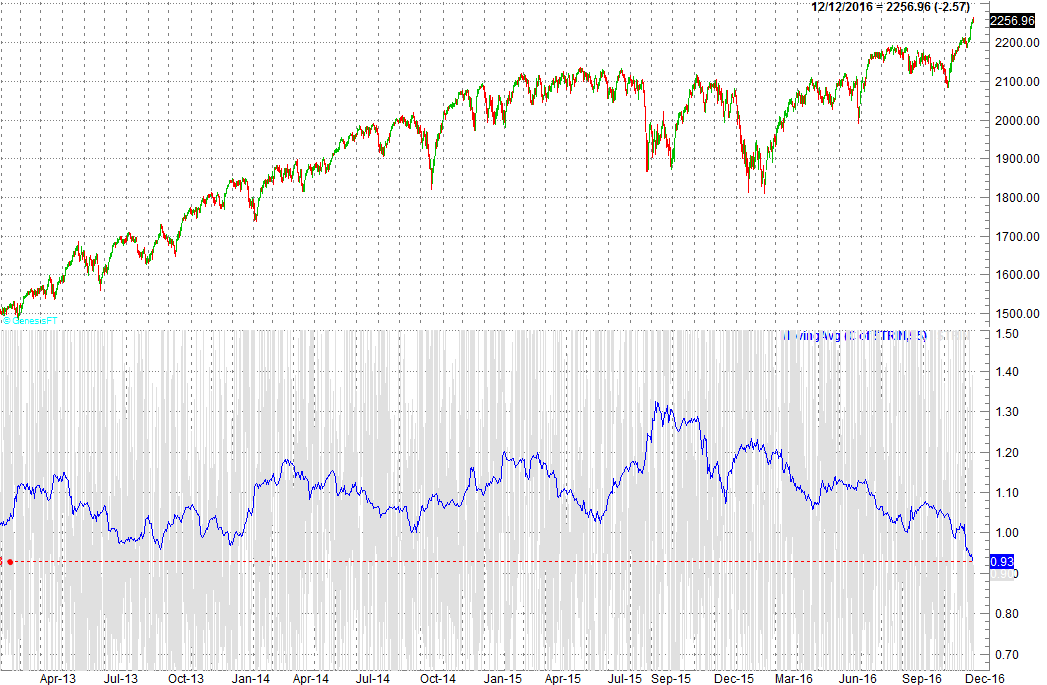
The chart below tells the tale, comparing the S&P 500 to the 55-day moving average line of the NYSE's daily TRIN reading. As you can see, the moving average is currently at 93.0, which is the lowest TRIN reading we've seen since the middle of 2007. It's been close a few times, but the long-term TRIN average hasn't been this low in almost a decade. [Click on the chart for full-screen view.]
What does it mean? It means that while most stocks are moving higher since early November, there's not a lot of bullish volume, or participation, in the move. In fact, one could say there's a dangerous lack of bullish volume behind the current rally effort.
That's going to be a problem sooner or later. Rallies need to gather participants on the way up - not lose the few they had.
Therein lies the rub, of course... "sooner than later" is hardly a precise call. The Arms Index can get and stay "too high" and "too low" for days if not weeks on end. This extreme low only indicates the propinquity for a pullback, rather than the definite beginning of one.
Still, this will assuredly lead to a significant setback at some point in the foreseeable future. It's an extreme rarity for bullish volume to "catch up" with the long-term advancer/decliner ratio that's gotten this far ahead of the up/down volume ratio.