Chart School: Our Ulta Beauty Trade Says Don't Make It More Complicated Than It Has to Be
Do you trade by the seat of your pants, getting in and out of a position more on your gut instinct than a well-reasoned plan? Don't sweat it if that sounds a little too much like you. You're not alone. Indeed, even the most disciplined of traders can get out of his or her proven approach from time to time.
Still, even a mediocre plan is better than no plan at all, and at the very least will keep you out of trouble.
It's a matter than begs one key question though: Why do so many traders not take the obvious trading hints they're given?
There may be several "right" answers, but the overarching one is that too many swing traders incorrectly feel that using anything besides their gut feeling isn't going to yield them results, but will take valuable time. Nothing could be further from the truth, however. In fact, the easier and simpler your interpretation of a chart is, the more trades you're apt to find, and the more likely you are to pull the plug at the right time.
A real-life trading situation will illustrate the idea as well as a full-blow trading sermon, so let's just walk through a scenario using the recent chart of Ulta Beauty (ULTA). It vexed a lot of people, but didn't have to. In fact, our Credit Spread Trader service recently booked a nice two-day win making the same basic play we're getting ready to dissect.
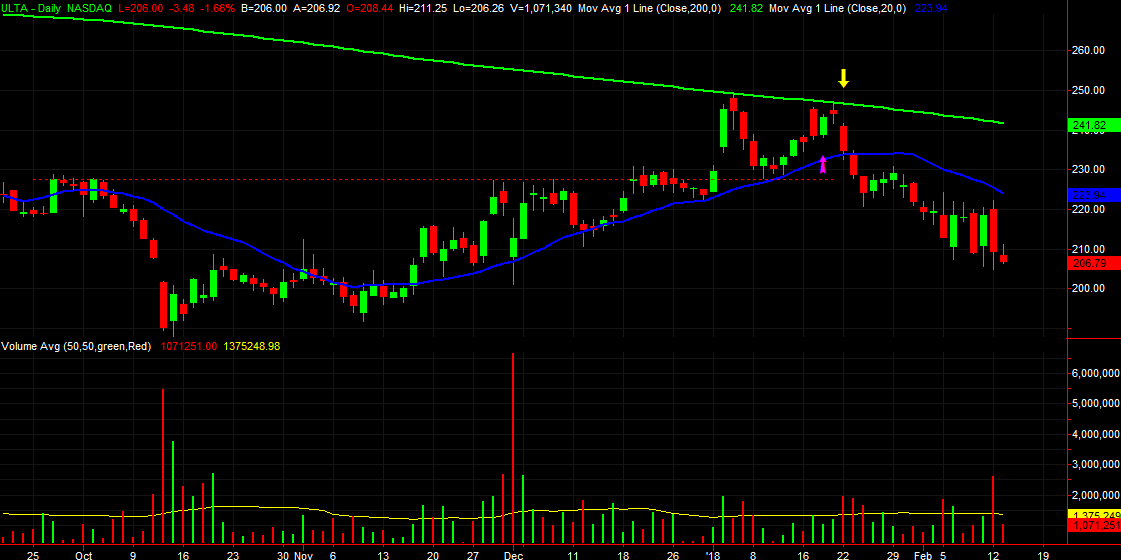
Take a look at the daily chart of ULTA, with only a 200-day (green) and 20-day (blue) moving average line plotted on the chart. At the bottom of the image is volume data; red marks bearish days, and green marks bullish ones. Our entry into the bearish spread trade [we sold calls, on a net basis] was made on January 18th, which is marked with a pink arrow. We sold calls for a net credit of 50 cents per contract pair.
With nothing more than a quick glance at the chart, this wouldn't have been a trade many people would have been excited about. They should have though. Why? Because, though just a few days prior Ulta Beauty shares found support - again - at the 20-day moving average line, as well as a horizontal ceiling (red, dashed) that had become a support line, the 200-day moving average line loomed above, and had already proven to be a problem.
Clearly it didn't get above that 200-day line on Friday, the 19th. Then the bears made a clear pivot on Monday, the 22nd with that day's doji-shaped bar.... another sign of a pivot at the perfect technical ceiling to make a pivot. Sure enough, the bears followed through. We got out on Monday the 22nd (the yellow arrow), covering our trade by buying back the options in the spread at a net price of only 20 cents per contract pair. We pocketed the 30 cent difference between the entry and the exit.
The other nuance of this chart setup is, it wasn't decidedly bearish. We just knew it wasn't likely that ULTA would easily breeze past the 200-day moving average line. Rather, it was likely that Ulta Beauty shares would linger around the 200-day line, spinning wheels and wasting time there. In that situation, we opted to sell calls (net) and let them lose value rather than buy a put and hope that it doesn't lose value - just because of the passage of time - in case Ulta shares didn't fall. The immediate pullback from ULTA just worked in our favor a lot faster than mere sideways action would have worked towards greater profitability on the trade by lowering our eventual exit cost. [Confused? Don't be. Here's the "why" of credit spreads. If you don't care and just want the chart/trading lesson, read on.]
The math isn't the point though. Neither is the idea of "not bullish" trade. The point is, by viewing the 200-day moving average line for the resistance that it was (and seeing a second day of above average-volume that was bearish after never seeing any real bullish volume), we were able to stick with a trade that didn't get off to a perfect start.
To be fair, this isn't all we were looking at when the Credit Spread Trader service made the call. And also be fair, not every trade works out quite this well in relation to the simplest of the technical tools all traders have access to. Sometimes there is no trading framework on a chart. On the other hand, you'd be surprised how often you can find some kind of simple-but-powerful technical context on a chart. Use those clues you've been given. We always do.
The irony is, a small army of "sophisticated traders" would almost laugh at the idea of using something so low-brow and simple as moving average lines and the shape of each day's bar as a clue. Though these ideas may have worked in the past, trading is far more complicated and elusive than these old-school interpretations can navigate, they say.
Thing is, they're wrong. It's the simplest of tools and interpretations that often end up being the most powerful ones. If you can combine them with some of the higher-level stuff BigTrends uses and teaches (see our trading-training classes for that), you might be shocked how easily you can take your trading to the next level. Most traders crash and burn not because they don't know enough, but because they try and make things way too complicated and don't have enough discipline or guts to keep it simple.
In the meantime, if you'd like to learn by doing and master the art of income-oriented credit spreads, the Credit Spread Trader Advisory service is a great way to pick up on some of the higher-level tips that help you get more out of the basic trading ideas discussed above.