Given Monday's gains and most of the indices move to within reach of new record highs, it would be easy to assume the underpinnings of the rally are plenty healthy. That's not actually the case though. In reality, the market's breadth and depth --the rallies participation and subsequent volume -- are done only unhealthy, they're getting sicker. Specifically, the number of NYSE stocks they can forward progress on any given day is not only subpar, but recently getting worse. Meanwhile, the number of the NYSE stocks losing ground on any given day is starting to grow again.
Similarly, the trading volume for the NYSE's advancers has been below average of late, and is trending lower (albeit modestly). Conversely, the volume four of the NYSE's decliners has been above average for the past several days, and is trending upward.
The chart of the S&P 500 below tells the tale. On Monday, 1398 of the NYSE's names edged higher, while 1511 of them moved lower... despite the S&P 500's 0.16% gain. At the same time, 305.5 million of the shares that traded on the Big Board on Monday did so as part of a bullish move, while 382.2 million of the shares that were transacted on the NYSE on Monday did so because they were being sold, logging a loss for the day.
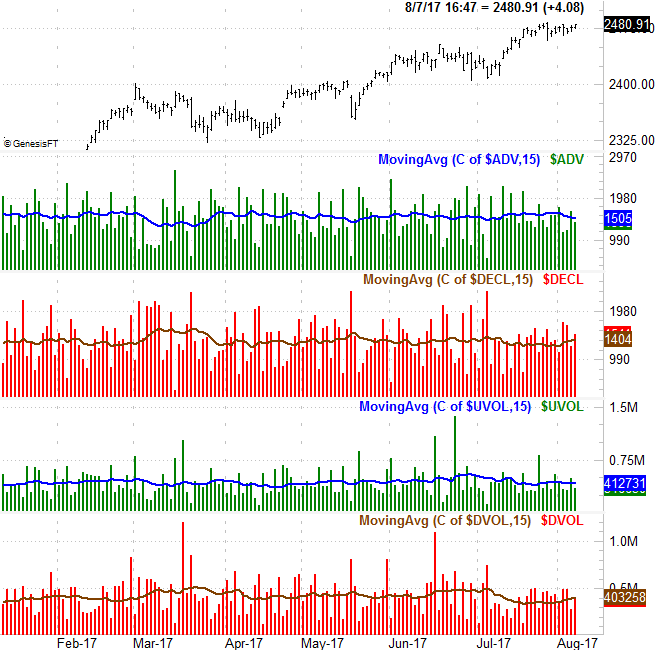
It begs the question: Exactly how good the S&P 500 manage to make any game at all during Monday's action? The answer is, a small handful of some of the bigger names did all of the heavy lifting. It worked, but it can't work forever.
The real red flag on the chart above, however, isn't just Monday's data. It's the trajectory of a moving average lines plotted on top of all of the raw daily data for each of the four datasets and question. The NYSE's bullish volume has been trending lower for a while now, and it's bearish volume has been growing since late July. Similarly, the number of inland sea of answers has been trending lower since early July, while the number of decliners has been rising for the past several days. We know this because of the direction the moving average lines are pointed.
It doesn't inherently mean the market is destined for a horrific crash, or even a crash at all. It does mean, however, that there's not as much psychological support for this rally then the rallies results so far would suggest. It's mostly a matter of the would-be bears not getting in the way. They're not likely to stay in the sidelines forever though.
The tricky part about looking at this data is timing. That is, just the cause the undertow is more bearish than bullish right now doesn't mean the uptrend is going to reverse any time soon (or as was suggested above, maybe it won't reverse at all). Being realistic though, we have to at least acknowledge there's something unusual going on that defies the norm for the market.
Curiously -- and this may explain why stocks are still chugging higher even though the tank is technically empty -- the NASDAQ's version of this chart looks different. For NASDAQ stocks, we're seeing more advancers led decliners for the past couple of sessions, and we're seeing more bullish volume and bearish volume. The bigger-picture trends are also less clear for the NASDAQ exchange's names.
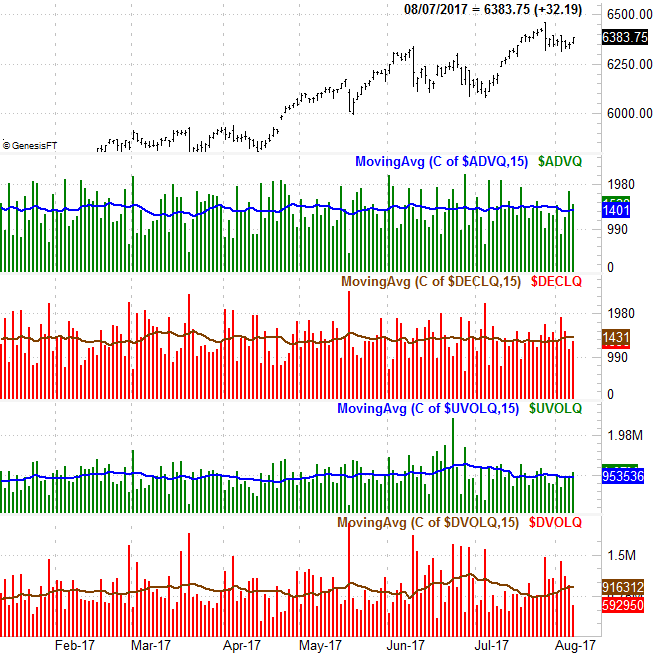
This isn't in complete conflict with the first chart, as many of the biggest names in the S&P 500 are also some of the biggest names that trade on the NASDAQ exchange. Namely, all of the popular FANG stocks are NASDAQ-listed stocks, and they alone can lift the S&P 500 index even when little else in the index is helping out. Again though, they can shoulder all the weight forever, nor can the FANG stocks continue to rally indefinitely without running into a profit-taking headwind.
For the time being though, the FANG stocks are bullish enough to overcome the drag all other names are providing.