
-- Ethereum continues to trade well, consolidating its recent gains above prior resistance. Here's why the charts suggest more upside --
By Bret Kenwell, TheStreet.com
Ethereum, Bitcoin and other cryptocurrencies continue to trade well, with most up massively on the year.
In fact, many are fresh off new all-time highs or are just below those highs made earlier this year. It's prompting many to ask what's next for this asset group.
For Ethereum, the cryptocurrency has a more recent catalyst catalyst: NFT. The market for NFTs - or non-fungible tokens - has taken off.
We've seen athletes like Eli and Peyton Manning, artists, musicians, producers and more getting involved as the market has gained sudden momentum.
In the NFT market, cash isn't king, Ethereum is. It's the currency customers pay in and the currency that merchants accept as payment.
I think that's helping to keep a bid in Ethereum and may even act as a catalyst to take it higher. Let's look at the charts.
Trading Ethereum
Daily chart of Ethereum
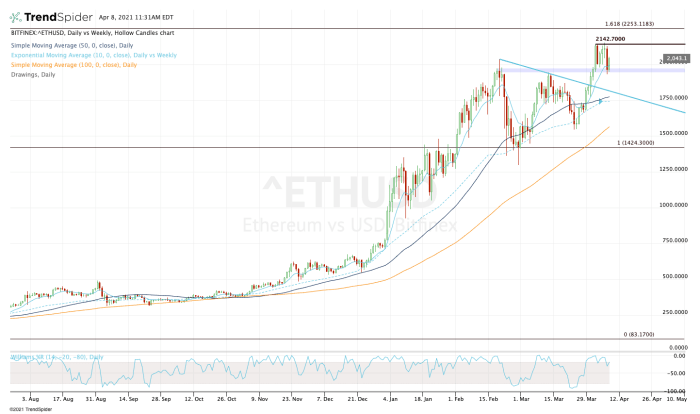
Chart courtesy of TrendSpider.com
Ethereum was forming a wedge pattern over the last few months, but ultimately resolved higher as bulls bid it higher in eight of nine trading sessions, starting in late March.
I like the setup in the chart for a few reasons. First, the stock ripped through downtrend resistance (blue line) and powered over the key $2,000 level and the former all-time high.
I also like that Ethereum pulled back to the 10-day moving average and the prior resistance zone between $1,950 and $1,975 and held this area as support. That's an important bullish development.
Given all of those developments - plus the bounce back above $2,000 - the momentum remains with the bulls amid this healthy pause.
From here, bulls can use this week's low as a warning point. A move below $1,930 and perhaps more downside will follow. If the 21-day moving average doesn't provide a bid, there are several measures that should act as ample support.
Specifically, I'm looking at the topside of former downtrend resistance, along with the 50-day and 10-week moving averages.
On the upside, look for a move over recent resistance, near $2,145. Above opens the door to the 161.8% extension near $2,250.
Until the trends reverse and until Ethereum breaks below key pivot points, it's prudent for investors to remain bullish. If they're skeptical, then it's OK to be neutral. However, the trend is our friend until it bends, and right now the trend doesn't favor the short side.
From TheStreet.com