Why is the Market Still So Expensive Heading into Q3 Earnings Season?
Amazingly enough, it's almost here. The end of the third quarter of 2017 is just a week and a half away, and the unofficial beginning of Q3's earnings season kicks off when Alcoa (AA) reports on October 18th. Plenty of major names will be reporting before then, however.
Translation: It's not too soon to start talking about what may be in store for the market, even if you're just a short-term trader. Earnings news can wreak some serious short-term havoc and catapult stocks in either direction, even if it's really only a long-term concern.
With that as the backdrop, as of the latest look, professional analysts collectively expect the S&P 500 to report earnings of $32.96 per share for the third quarter of 2017. That's 14.9% better than the year-ago bottom line, and would mean net income of $120.19 for the past four quarters combined. That translates into a trailing P/E of 20.8... above the long-term norm.
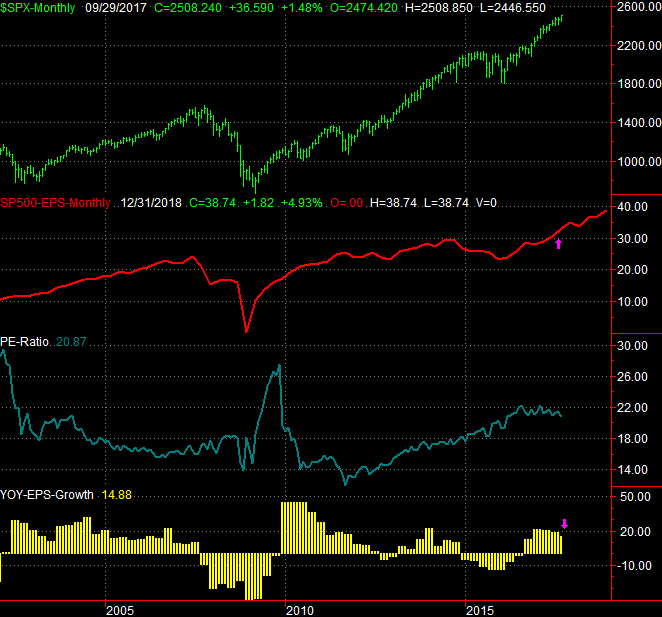
On a forward-looking basis, the projected P/E of 17.8 is also above the typical forward-looking P/E, though not leaps and bounds so.
Still, with interest rates on the rise, inflation creeping up and industrial activity slowing down, this isn't exactly an environment where we should blindly be giving the broad market the benefit of the doubt. What gives? The decision isn't quite as crazy as might think.
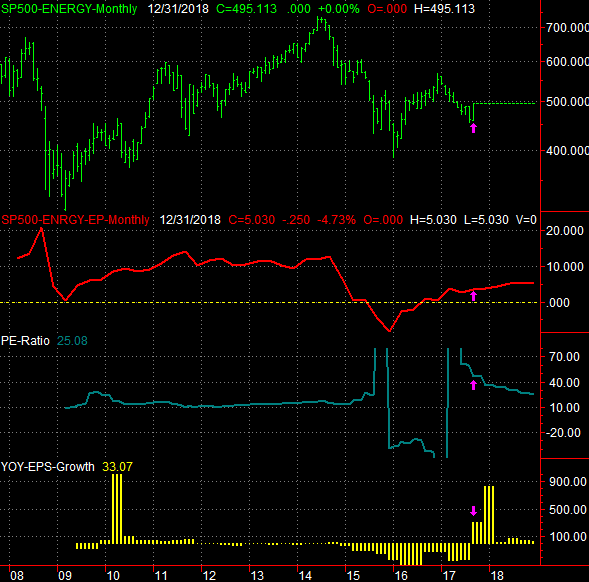
Though most investors more or less recognize the reality, most investors aren't able to -- mostly due to a lack of data -- crunch the numbers and figure out that a big piece of the reason stocks are still relatively expensive overall is indeed the struggling energy sector. It's recovering from the 2014/2015 implosion of crude oil prices, but the long road to recovery has yet to be fully traversed. Though these names are mostly profitable again, the profits they're turning are only about a third of what they were prior to the 2014 implosion. The chart of the S&P 500 Energy Sector Index with its profit track (past and projected) below illustrates the story very well. The pink arrows mark the current values, as of this month. Everything to the right of the pink arrows is a projection.
The trailing P/E of 46.8 is well above the pre-2015 norm of around 14.0. The S&P 500 Energy Index would need to earn something on the order of $10 per share per quarter to get back to its normal levels. It's no longer in the red, but the Q3 earnings estimate of $3.59 is still miles away from its historical average.
To be clear, the energy sector's stocks' demise since their 2014 peak has helped make a much-needed adjustment for the entire S&P 500, shaving something on the order of 8% of its value between 2014 and late 2015. That's not really enough to right-size the S&P 500's trailing P/E value... nor should it be fully adjusted in that manner. The energy sector's losses in 2015 and 2016 were never a permanent condition.
Here's the same idea from a different perspective -- a comparative, historical look at the P/E ratios of all the major sectors. With the exception of real estate (which isn't a meaningful basis for comparison), energy stocks are still unusually expensive compared to their long-term norms. Oil and gas stocks still comprise about a tenth of the S&P 500 though, so when they're this expensive, the market is going to be overpriced as well.
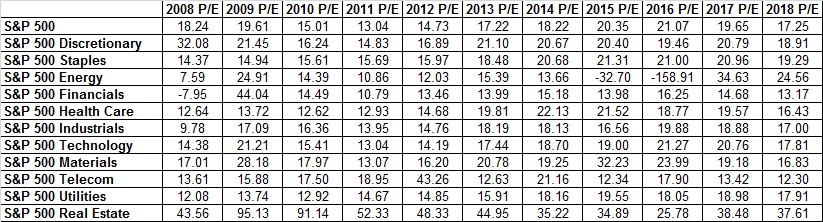
That's not to suggest the energy sector is the only reason the market's arguably overvalued here. Staples stocks are anything but cheap, and even tech stocks are expensive by long-term standards. Oil and gas names are the key culprit though, and until they get right-priced, a rich valuation for the S&P 500 is the new norm.
Even that forward-looking P/E of 17.7 for the S&P 500 is above its long-term average, and that's mostly due to the fact that energy stocks aren't expected to grow their bottom lines much beyond what they're doing now. It would take sustained oil prices in excess of $55 per barrel -- and really, above $60 -- for the energy sector to make a decent-sized positive dent for the marketwide bottom line.
While earnings season may be a glimpse into one chapter of a saga for individial companies, the inherent volatility of earnings reports sets the stage for countless short-term tradinng opportunities. Why not take full advantage of them? The BigTrends Earnings Explosion advisory can help you find some of the biggest, trade-worthy moves stemming from earnings reports. Learn more about this amazing alert service right here.