
-- Nvidia and AMD have been best-of-breed growth stocks, as the stocks hit record highs. Here's how to trade them now --
By Bret Kenwell, TheStreet.com
The semiconductor stocks have been doing quite well lately and Nvidia (NVDA) and Advanced Micro Devices (AMD) have been leading the way.
Nvidia and AMD have become staple holdings in growth investors' portfolios, particularly at a time when growth stocks are in a nasty bear market.
Only a handful of growth stocks are at or near their highs and these two stocks are two of them.
While growth stocks may have bottomed, they're not out of the woods quite yet.
Solid earnings from Taiwan Semiconductor (TSM) are a confidence booster, as is the push to record highs from Broadcom (AVGO) on solid quarterly results.
Let's look at the charts for Nvidia and AMD.
Trading Nvidia Stock
Daily chart of Nvidia stock
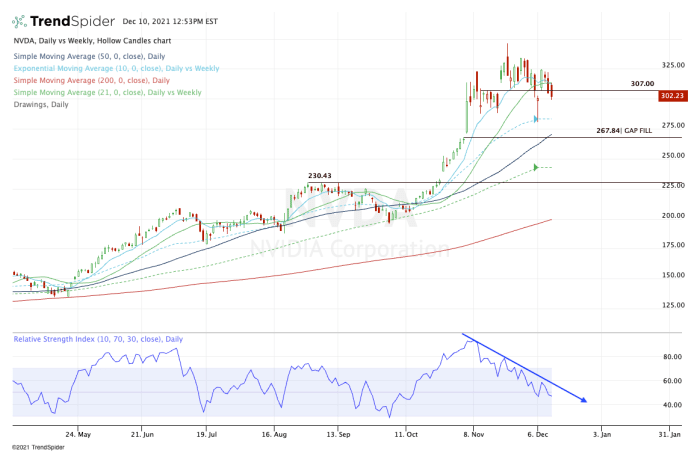
Chart courtesy of TrendSpider.com
There was a tremendous amount of bearish divergence in Nvidia when the stock made its push to record highs.
The ensuing pullback sent shares to the 10-week moving average, where it gave a fairly robust rebound. However, that rally stalled at the $325 area and the stock is now rolling back over.
There are pros and cons with Friday's action.
On the plus side, the stock filled its gap from Tuesday near $302.50. Unfortunately though, that's got Nvidia stock below the key $307 level.
If the stock can reclaim $307 and its short-term moving averages, then $325 is the next upside level to watch. Above that and the mid-$330s is on the table, followed by the record high near $346.50.
On the downside, keep an eye on the 10-week moving average. Below opens Nvidia up to the 50-day moving average and the $268 gap fill area.
Trading AMD Stock
Daily chart of AMD stock
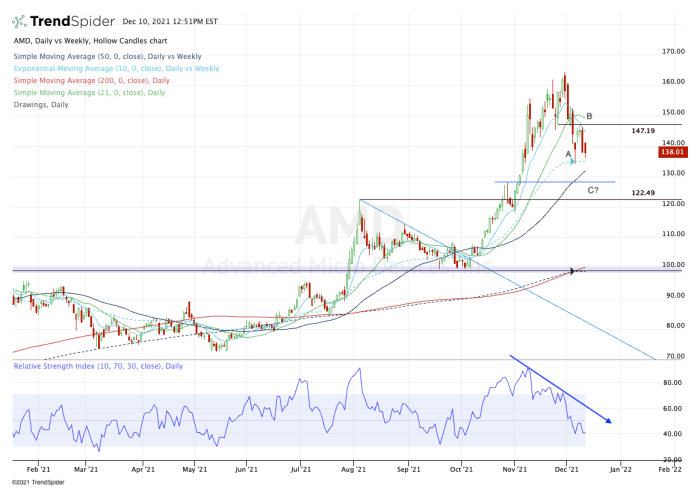
Chart courtesy of TrendSpider.com
AMD has a similar look to Nvidia, with strong bearish divergence on the daily chart. That occurred as the RSI was failing to make new highs while the stock price was making new highs.
For AMD, shares pushed up to a high of $164.46, then reversed hard. The subsequent bounce had trouble reclaiming $150 and the 10-day moving average before the stock dropped down to the 10-week moving average.
Like Nvidia, AMD had a solid bounce from this level.
However, the $147 area and short-term moving averages rejected the stock. That has traders in a wait-and-see situation.
Specifically, can the stock push back up through $147, then $150? Otherwise we have to look at the potential downside levels.
This week's low and 10-week moving average are obvious spots to keep an eye on. However, we already had a strong bounce from this zone. Is it too much to expect another?
A break lower could put the 50-day moving average in play. That's followed by the $126 to $128 area.
From TheStreet.com