Weekly Market Outlook - When a Small Problem Isn't So Small
Last week was a winner. The S&P 500 gained an impressive 3.2%, in fact, touching the highest highs it's seen since early March.
The move was problematic though, for a couple of different reasons. Not only is the market now uniquely vulnerable to at least a little weakness (that could turn into much more weakness), the S&P 500's advance was suspiciously stopped at a major technical line in the sand. In short, the bulls chickened out right where they shouldn't have.
We'll take a detailed look below -- as always -- right after a review of last week's economic announcements and a preview of this week's economic news.
Economic Data Analysis
Not a terribly busy week last week in terms of economic news... perhaps for the best. The data hasn't been particularly great of late. The data we got wasn't an exception to that norm.
Case in point: Building permits and housing starts. They both fell, a lot, in the first full month of the real coronavirus fallout. Permits slipped from 1.35 million in March to 1.07 million ()annualized) in April. Starts fell from a pace of 1.27 million to 891,000.
Building Permits and Housing Starts Charts
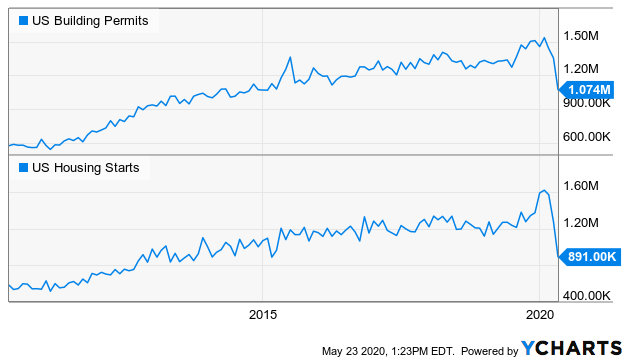
Source: YCharts
As is the case with everything right now, take the tumble with a grain of salt. It's not so much a lack of willingness or qualification as it is the ability to actually start building. Ditto for the other disastrous real estate data from last week.... sales of existing homes. They slumped from an annual pace of 5.27 million to 4.33 million in April. New home sales will be posted this week, and should show a similar deceleration.
Existing Home Sales Chart
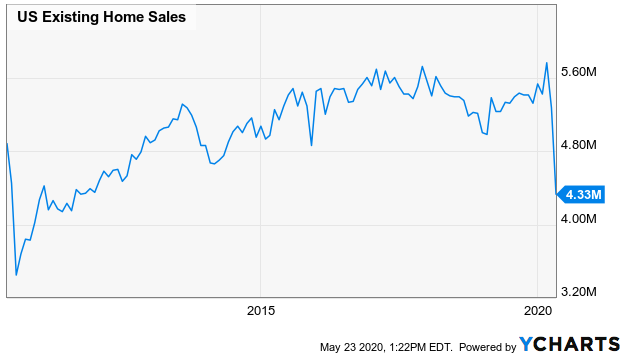
Source: YCharts
Everything else is on the grid. A few people have asked about unemployment claims, though we've yet to broach the subject or supply a chart for a couple of different reasons. One of them is, we can't access a chart from our source to show you. The other us, the chart would mean little anyway. It's so skewed here that it defies any meaningful visual analysis.
Economic Calendar
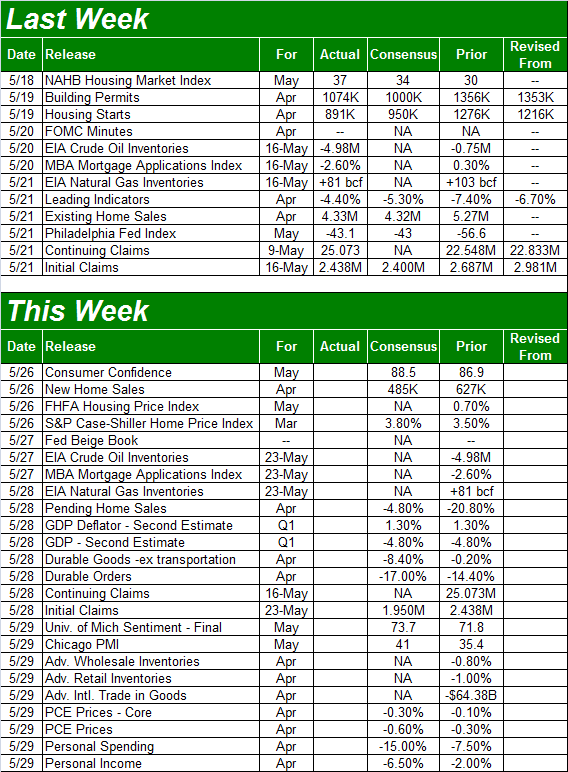
Source: Briefing.com
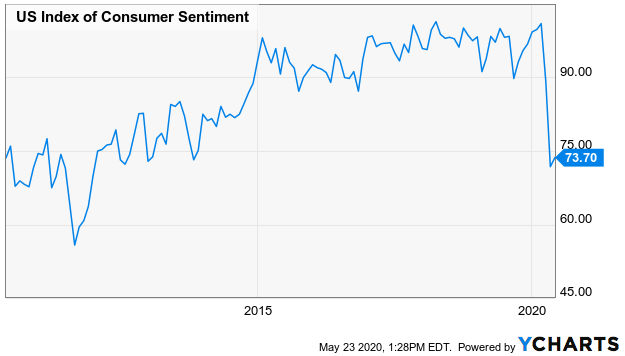
This week is going to be a busy one, kicking off with Tuesday's look at the Conference Board's measure of consumer confidence, and ending on Friday with a look at the University of Michigan's sentiment report. Both have been beaten down pretty well. But, a bit of good news on this front -- economists think poor sentiment is bottoming, with calls for slight increases of April's rough figures on the table.
University of Michigan Sentiment Index Chart
Source: YCharts
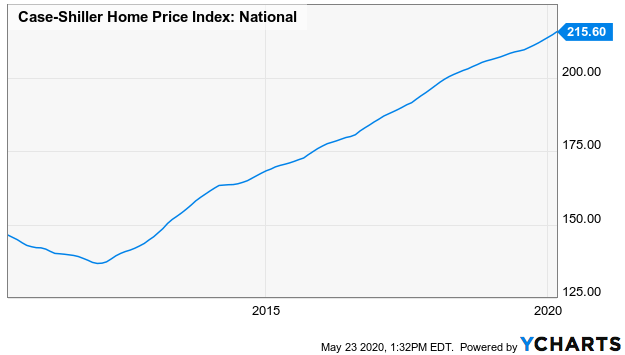
This week will also finish up May's look at the real estate market with looks at home values. The FHFA's housing price index along with the Case-Shiller index will be posted on Tuesday, and each should be up just a bit. That sounds impossible, but bear in mind the data is based on the average price of sold houses but does not consider how few of them are currently selling.
Case-Shiller Home Price Index Chart
Source: YCharts
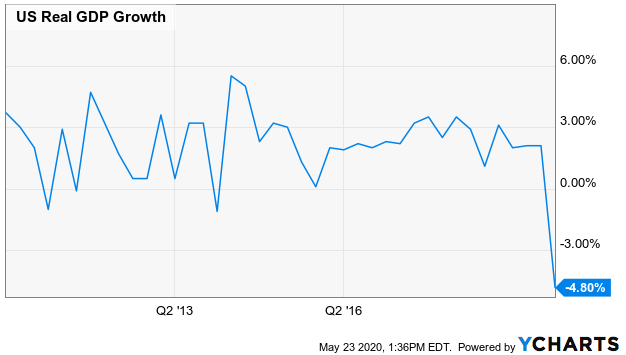
The only other biggie in store for this week isn't necessarily something to sweat too much, as it means little at this point. That's the second look at Q1's GDP growth rate. Analysts still say it contracted 4.8% last quarter.
GDP Growth Chart
Source: YCharts
Stock Market Index Analysis
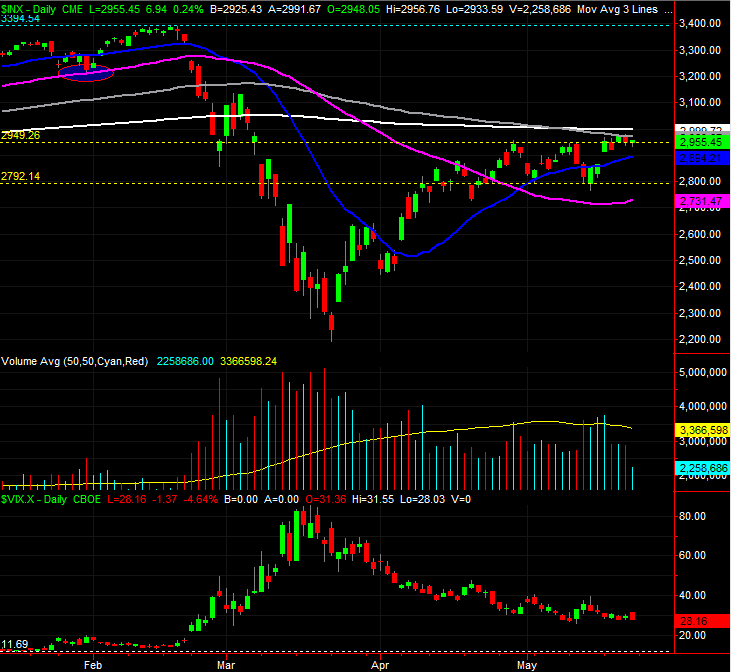
The good news: The S&P 500 hurdled the technical resistance that had set up around 2949.26 (the upper, yellow dashed line on the chart below). The bad news is, Monday's big jump left behind a gap that's now apt to be closed. The even-worse news: The advance was stopped cold at the 100-day moving average line (gray) at just under 3000. The precision with which that happened is daunting, made more alarming by the fact that the buying volume fell apart once the technical resistance was encountered.
S&P 500 Daily Chart, with VIX and Volume
Source: TradeStation
It's worth noting that the NASDAQ Composite isn't finding the same problem. It's well above all of its moving averages. In fact, a couple of weeks ago it found support at the convergence of its 100-day (gray) and 20-day (blue) moving average lines.
NASDAQ Composite Daily Chart, with VXN
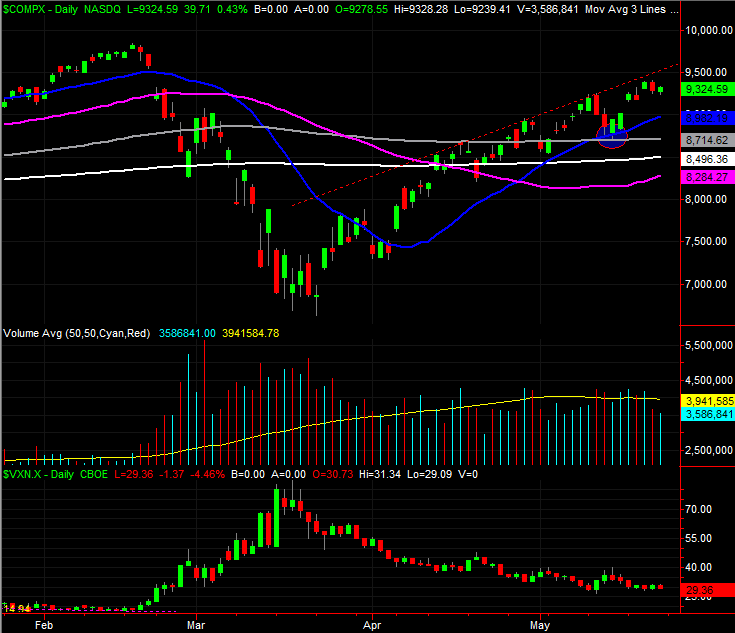
Source: TradeStation
That's not to say the composite is bulletproof. Like the S&P 500, the NASDAQ Composite left behind an opening gap on Monday. And, also like the S&P 500, the NASDAQ's buying volume is waning on the way up. These aren't exactly ideal. They aren't necessarily rally killers either -- the bulls may be waiting to see how or if the market handles its first real test. The fact that the NASDAQ is leading the charge is also a strong sign in and of itself. The overarching issue is, we won't know traders' true temperament until that first test is over with and done.
Problem: Last Monday's opening gap could pull the market lower in an effort to fill them in, but that effort could start a wave of profit-taking that continues to drag stocks lower.
The key (for the bulls) will be stopping that prospective selloff before it develops momentum. To that end, there's plenty of opportunity for that to happen.... especially for the all-important NASDAQ. All those moving average lines peppered between 8982 and 8284? They've all got a chance to do that, and rekindle the rally in the process.
In the same vein, note that the 50-day moving average line (purple) seems close to crossing back above the 200-day moving average line (white) at 8496.36. That would unwind the so-called "death cross" that sent investors into a panic in mid-April.
Trading of course has turned into a glorified guessing game, largely hinging on the next coronavirus-related headline, and how each of the various societal/cultural/political forces will spin it. In the grand, GRAND scheme of things though, the volatility since February -- and really the volatility since 2017 -- still has the market in the same bullish trend it's been in since 2009.
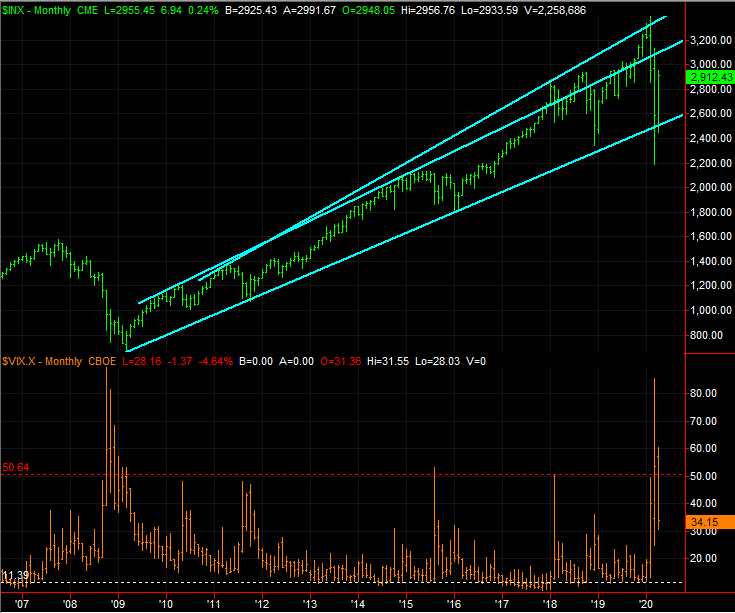
Take a look at the MONTHLY chart of the S&P 500 below. We're right back in the middle of the rising channel that's been built since the bull market began. There's still plenty of room within the channel to maneuver. Technically speaking, we can squeeze a whole bear market into the confines of the floor and ceiling of this channel and still not break the broad uptrend.
S&P 500 Monthly Chart, with Volatility Index
Source: TradeStation
Whatever the case, should the near-term technical support not hold the NASDAQ up if it's tested, the lower boundary of the bull market currently lies at 2531.
In the same vein, the VIX's current value of 34.15 is well above its absolute floor near 11.0. That leaves lots of room for traders to add to their currently-wobbly optimism, and send the market higher in the process.