Weekly Market Outlook - This Uptrend is Still Too Fragile
 Though last week's trading action was shortened by the holiday break, the market managed to squeeze a heck of a lot of action - most of it bullish - into just three and a half days. The market didn't end the week on a particularly high note, to be fair, but it still managed to dish out a much-needed winner. The S&P 500 rallied 2.86% last week, at least temporarily stopping the bleeding and serving up a glimmer of hope.
If that rebound effort is to take hold this week, it's going to require some careful, smart navigation by the bulls.
We'll talk about how the needle needs to be threaded below, as always. First, let's run through last week's economic reports and preview this week's new. Between a market rout and subsequent bounce against all the chatter about the end of one year and the beginning of another, many investors have lost sight of the bigger picture.
Economic Data Analysis
It wasn't a terribly busy week last week in terms of economic news, but it was a huge one for the real estate landscape. We rounded out the bigger picture with a look at October's home price date. The S&P Case-Shiller Home Price Index was up 5.0% year-over-year, following September's 5.1% rise. And, the FHFA's home-price measure indicated values were up 0.3% month-to-month. In both cases, the trend has warmed up again after cooling off a bit in the middle of the year.
Home Price Index Charts
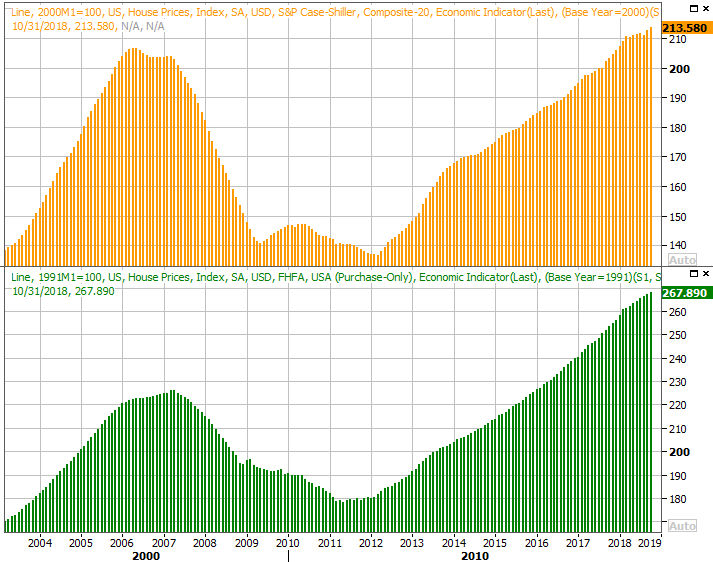
Source: Thomson Reuters
As a reminder, we learned a week ago that home sales have also perked up after an alarming lull. Existing home sales have ticked higher a couple months in a row now, and given the data in hand, new home sales will likely turn higher for November once that data is posted next week. (Here's where to see the most recent sales and inventory data: https://www.bigtrends.com/education/markets/weekly-market-outlook-so-bad-its-good-maybe-or)
Last week we also heard the Conference Board's consumer confidence reading for December. As expected, it fell, though fell more than expected. It's still high, and not in a downtrend. Indeed, the uptrend is still technically intact, though we'd like it to be a little more reliable. Ditto for the Michigan Sentiment Index.
Consumer Sentiment Charts
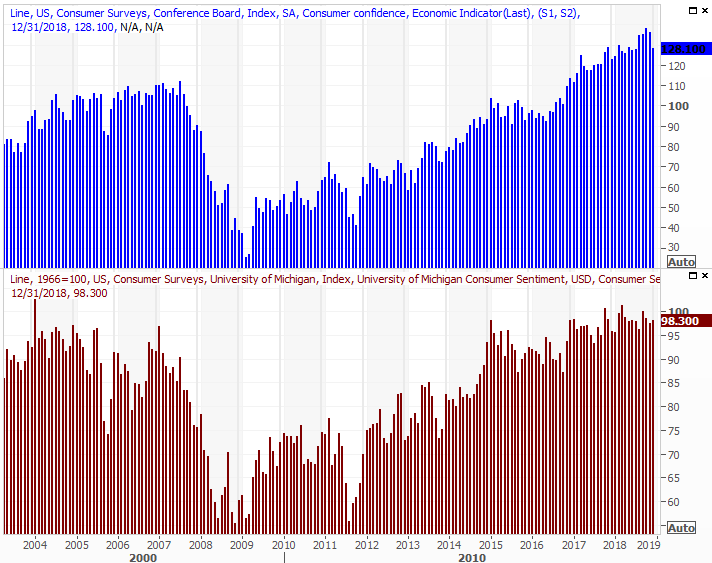
Source: Thomson Reuters
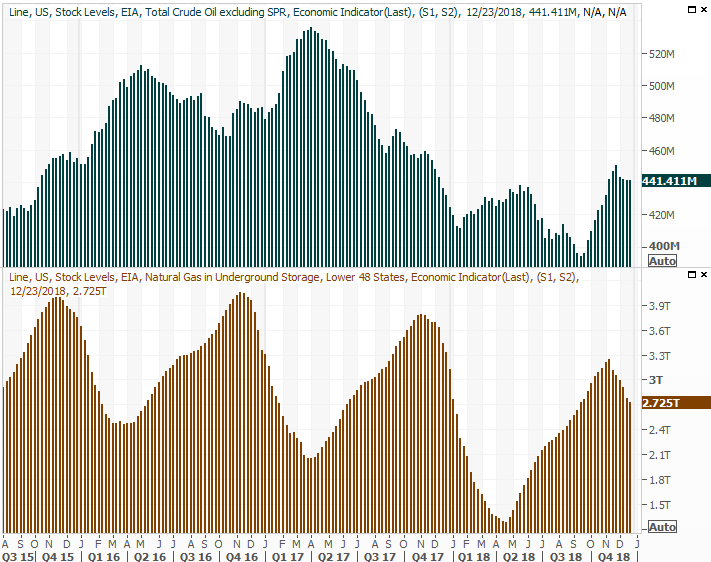
Finally, although we didn't preview it a week ago, we got another look at crude oil inventory levels last week. Despite plunging crude prices, oil stockpiles are leveling out, never having exploded as hinted by the strong surge in Q3.
Crude Oil, Natural Gas Inventory Charts
Source: Thomson Reuters
Everything else is on the grid.
Economic Calendar
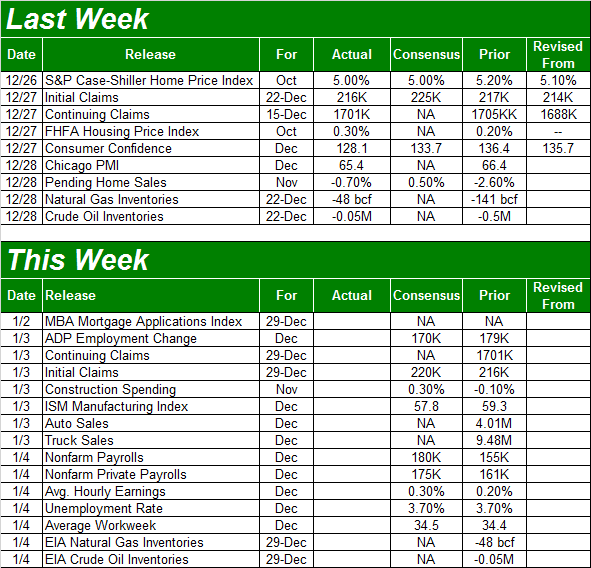
Source: Briefing.com
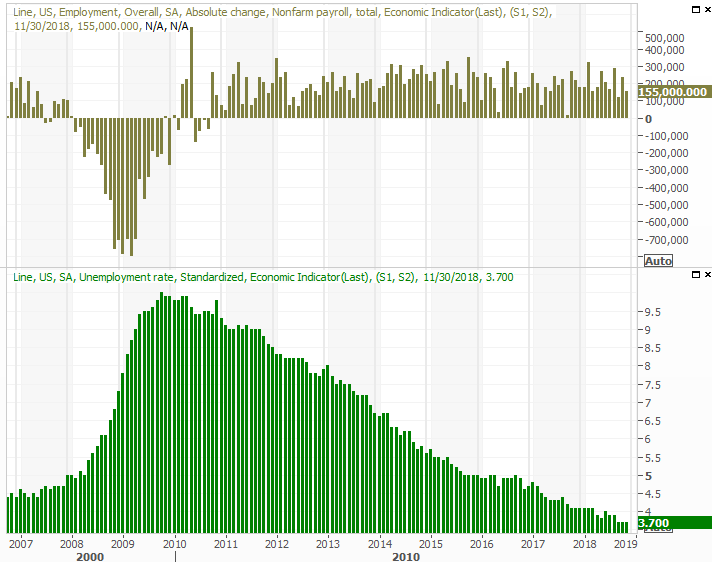
This week isn't going to be terribly busy, but it will end with a bang. On Friday, look for December's employment report. Economists are calling for 180,000 new jobs, up firmly from November's total growth. That won't be enough to lower the unemployment rate from November's 3.7%, though only because 3.7% is about as good as it gets.
Unemployment Rate, Job Growth Charts
Source: Thomson Reuters
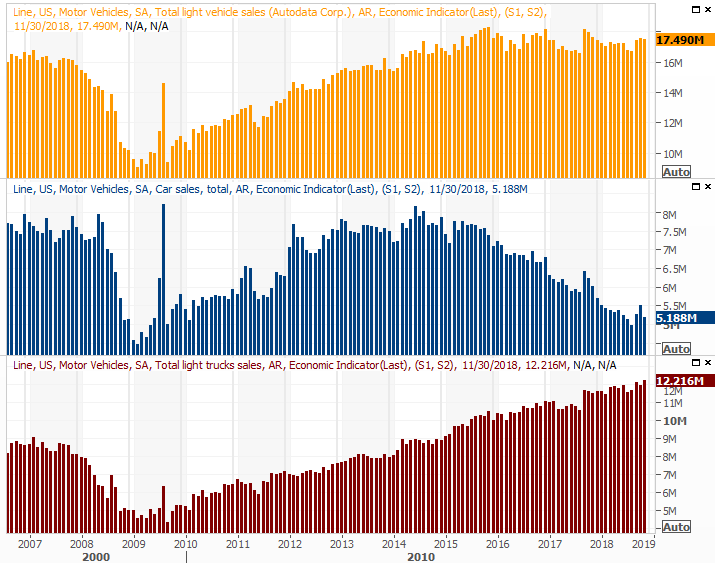
Before that though, on Thursday we'll get a look at December's auto sales.
Car and truck purchases had ratcheted up a bit following this year's rather rough hurricane season. But, even that pop is starting to fade, redefining the so-called 'peak auto' from 2016. Don't be surprised to see the overall tally continue to fade.
Automobile Sales Charts
Source: Thomson Reuters
Stock Market Index Analysis
All in all, not a bad reversal effort. On the other hand, after the severity of the selloff between the 13th and the 24th - an 11.2% tumble in just seven trading days - a bounce of some sort was more or less inevitable. The question now is, are the bulls willing to add to the effort.
Don't sweat Friday's lull. The bulls were just plain tired by then after a two-day romp, and that day's volume was light anyway. There's still room and reason for the market to keep running, though even if it does, that still won't necessarily get the market over the hump.
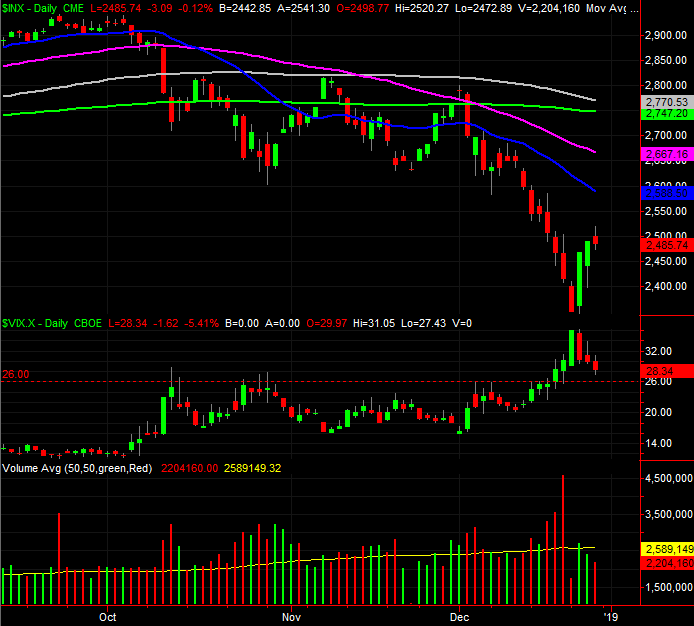
Take a look at the daily chart of the S&P 500 below. Notice how far below all the key moving average lines the index still is. Until all of them are below the index, the market is still vulnerable.
S&P 500 Daily Chart, with Volume
Source: TradeStation
There still plenty working in favor of the market right now, though that bullish undertow is best understood with a look at the weekly chart. Namely, look how unusually large the selloff since September has been. And, notice how the VIX finally hit an oddly high peak.
S&P 500 Weekly Chart, with Volume
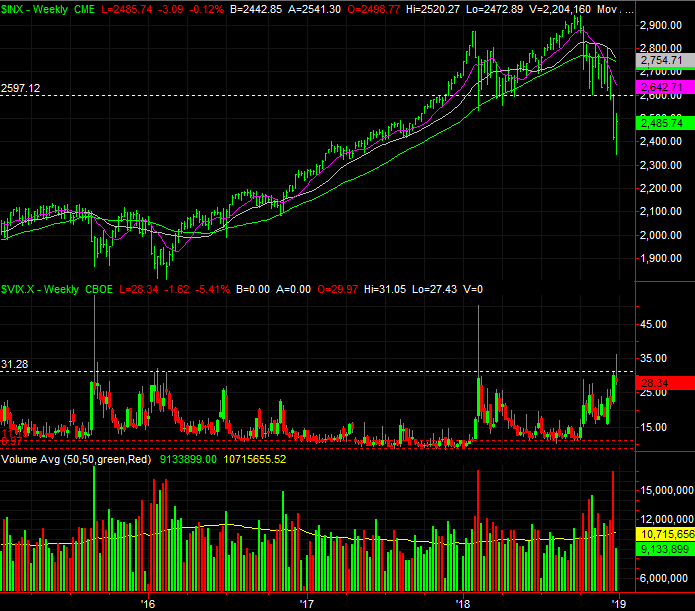
Source: TradeStation
It wasn't a 'crazy high' peak from the VIX like we've seen with past major bottoms. But, it'll serve as enough of a reset for the time being. Traders are in a weird place, psychologically right now, and none of them are thinking in the long terms that usually inspire strong VIX spikes. This may be, on a relative basis, as good as a bottom is going to get.
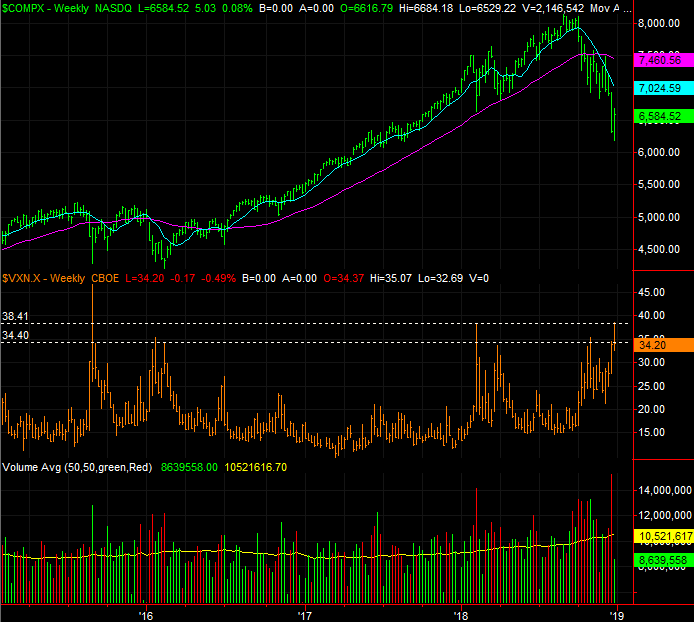
On that note, know that the NASDAQ's Volatility Index, the VXN, did reach a major peak last week that suggests the last of the would-be sellers were completely flushed out.
NASDAQ Composite Weekly Chart, with Volume
Source: TradeStation
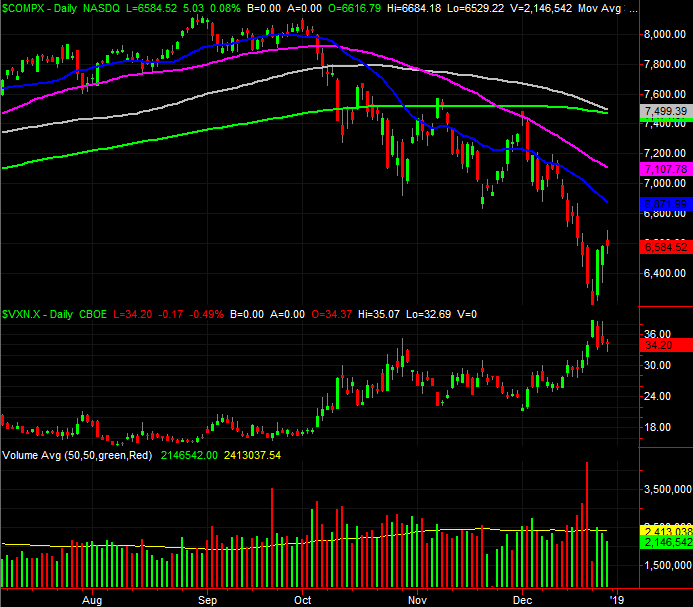
Zooming back in to the daily chart of the NASDAQ doesn't tell us a whole lot that we don't already know. But, it does once again show us just how ugly the pullback has been.
NASDAQ Composite Daily Chart, with Volume
Source: TradeStation
Bottom line? Anything could happen from here.
Making matters worse is the transition from one year to the next. This time of year is usually bullish. But, given the sheer scope of the selloff, one would think the bulls wouldn't back off just like they did on Friday.
Today is also likely to be something of a dud. Traders are still in holiday mode, and being only a half-day, many will simply take the whole day off. The fireworks won't begin in earnest until Wednesday, when normal trading resumes and the new year is here. That's going to be the real test.
Given the backdrop, we're leaning bullishly. As we've already said though, the wrong headline delivered at the wrong time could easily break this fragile rebound effort.