Weekly Market Outlook - This is Where the Bears Have Another Shot
Another week, another winner for the market. Though the bulk of last week's gain took shape on Friday, it's still the sixth straight week of forward progress.
It's the right time of year for bullishness. But, it's not the right context. We never went through the September/October lull that usually sets up the so-called Santa Claus rally. That makes this advance a little suspect. Underscoring that suspicion is the fact the earnings aren't exactly red hot. They're coming in lower than last year's Q3, and while there's hope for a trade deal with China, hope doesn't pay the bills. Stocks are also outrageously priced. Nonetheless, momentum is momentum.
We'll weigh both sides of the argument below. First though, let's recap last week's economic news and look at what's on the docket for this week.
Economic Data Analysis
Last week was a busy one, with several hard-hitting data nuggets.
It was a particularly important week regarding interest rates, with updates of consumer as well as producer inflation. Both remain in check, but cheap money and relatively easy credit allowed prices to rise a little more than expected. Inflation is still mostly contained; last month's increase may have been largely a response to September's surprise dip. Still, the overall annualized inflation rate of 1.77% is up a bit from September's pace, leaving investors wondering if a string of rare cuts has set the stage for unchecked inflation.
Annualized Inflation Rate Charts
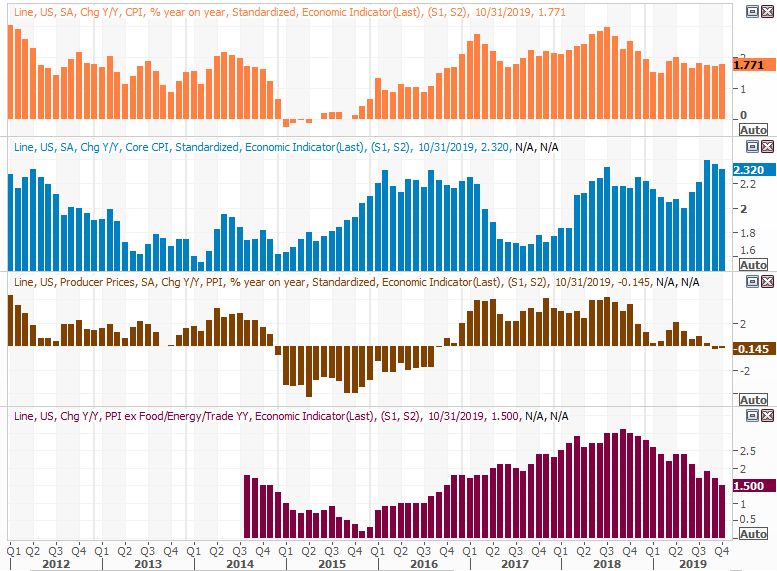
Source: Thomson Reuters Eikon
Notice that non-core consumer inflation is the only measure that was up last month.
Broadly speaking though, the economic news from last week was more discouraging than encouraging. Case in point? The Fed's capacity utilization and industrial productivity. Economist knew they'd be lower, but they underestimated that drop.
Industrial Productivity and Capacity Utilization Charts
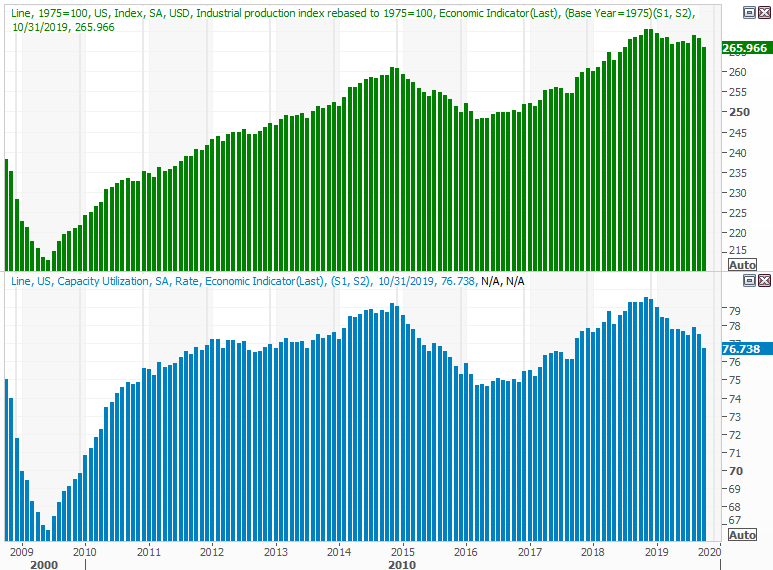
Source: Thomson Reuters Eikon
This is a problem for the long-term market trend, Indeed, this is THE problem for the long-term market trend. Stocks are clearly advancing right now, but production -- and earnings -- aren't moving in the same direction. Both data sets have been trending lower for some time now. It hasn't worked against stocks yet, but something's got to change soon.
In that same vein, retail spending was up last month, though not as much as expected... particularly given they slipped in September. It wasn't much of a recovery.
YOY Retail Sales Growth Charts

Source: Thomson Reuters Eikon
Take note of the fact that the pace of retail consumption has slowed for a couple of months now. Everything else is on the grid.
Economic Calendar
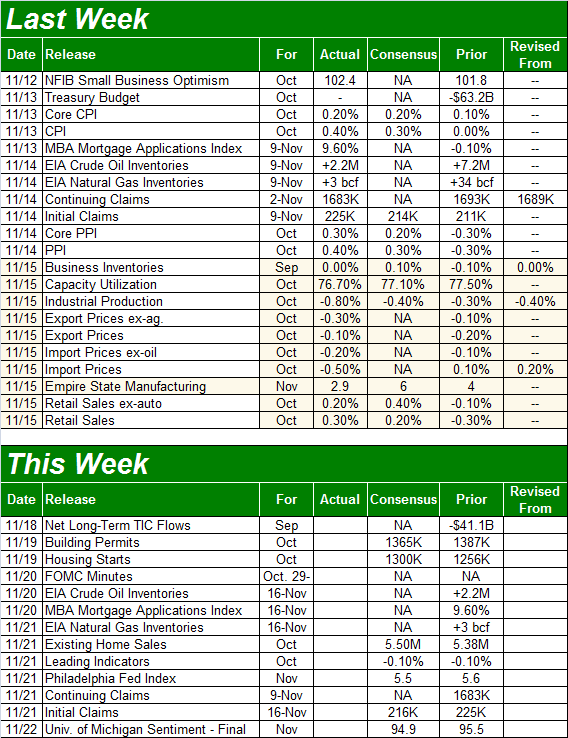
Source: Briefing.com
This week won't be as busy, though it's going to be a pretty big week for real estate. On Tuesday we'll hear about last month's starts and permits, and then on Thursday we'll hear about October's sales of existing homes. (New home sales won't be posted until next week.)
The pros are calling for about the same pace of housing starts and building permits -- a pace we've more or less seen for a couple of years now.
Housing Starts and Building Permits Charts
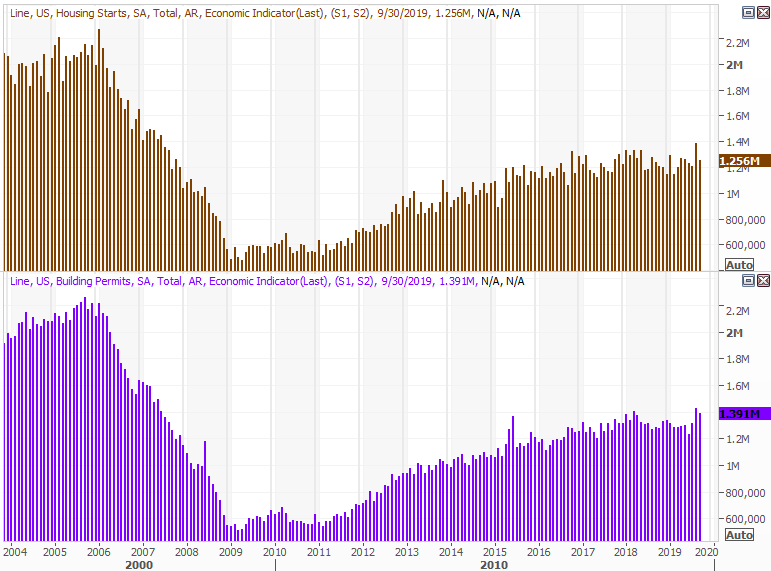
Source: Thomson Reuters Eikon
Sales of existing homes should be a little higher for last month, although the trend here remains uncertain. The status, however, is reasonably healthy. Real estate isn't a sore spot for the economy, even if price growth is tapering off.
New and Existing Home Sales Charts, with Inventory Levels
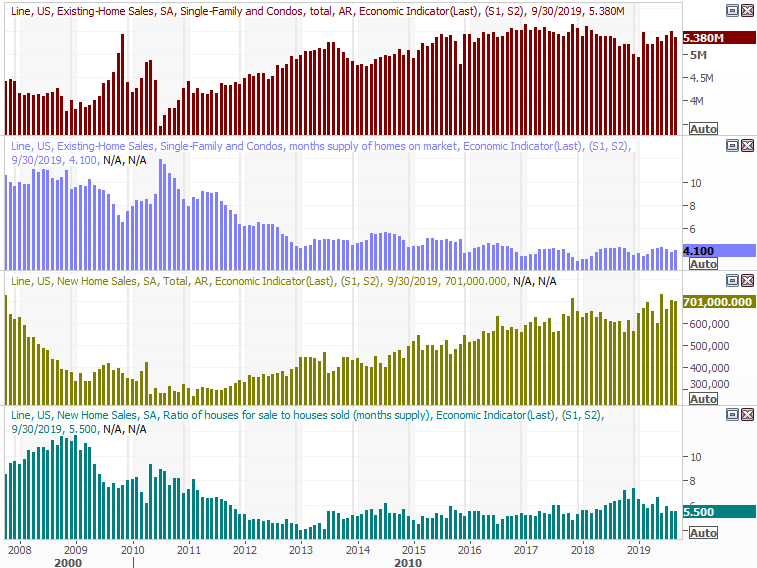
Source: Thomson Reuters Eikon
Stock Market Index Analysis
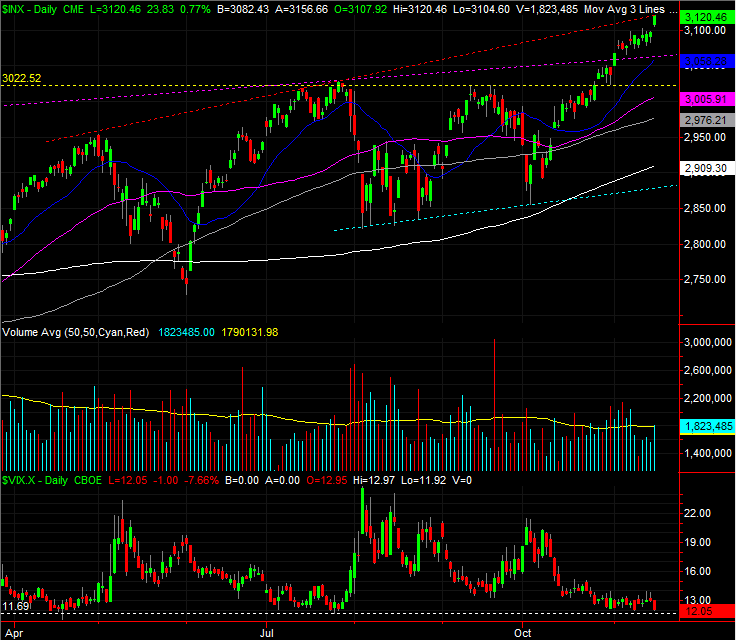
The momentum is enticing, but beware. Both of the key indices reached pretty well defined technical ceiling on Friday, simultaneously logging what's near the maximum unfettered runup possible in an environment such as this one.
The specifics: The S&P 500 has rallied 9.2% from its early October low. That's more or less in line with the 11% run between early June and late July. Also notice Friday's high aligns with the July and May peak, suggesting a technical ceiling has been bumped. This would be the ideal place for the bears to make their stand.
S&P 500 Daily Chart, with VIX and Volume
Source: TradeStation
You can sense it on the daily chart, but you can clearly see it on the weekly chart... the VIX is pausing at it nears the floor around 11.4. The same weekly chart's RSI line is as near to being officially overbought as it's been since the middle of 2018 (when the market cam unraveled). In the same sense, notice how the index has been range-bounce since May's high. The red, dashed line is the upper boundary of that range.
S&P 500 Weekly Chart, with VIX
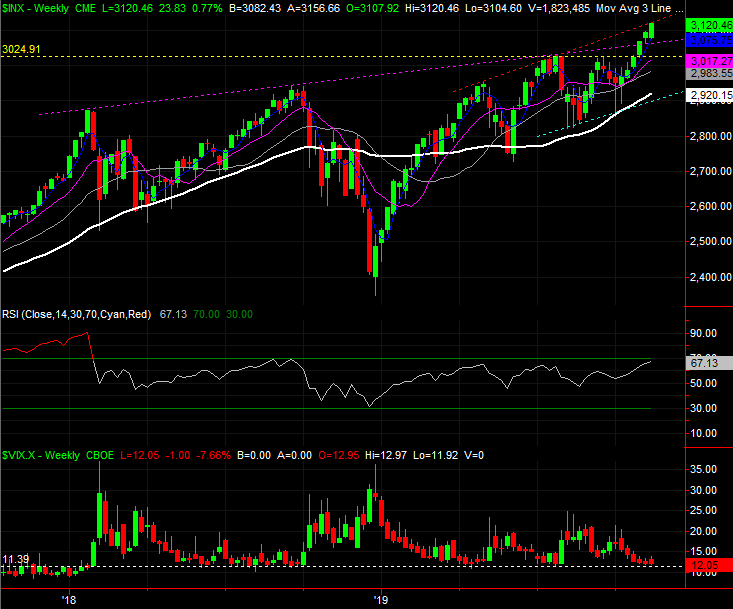
Source: TradeStation
The same details apply to the NASDAQ Composite. That is, it too bumped into the line that connects April's and July's peaks (red, dashed), but didn't go any farther. The VXN is also dancing with its absolute floor.
NASDAQ Daily Chart, with VXN and Volume
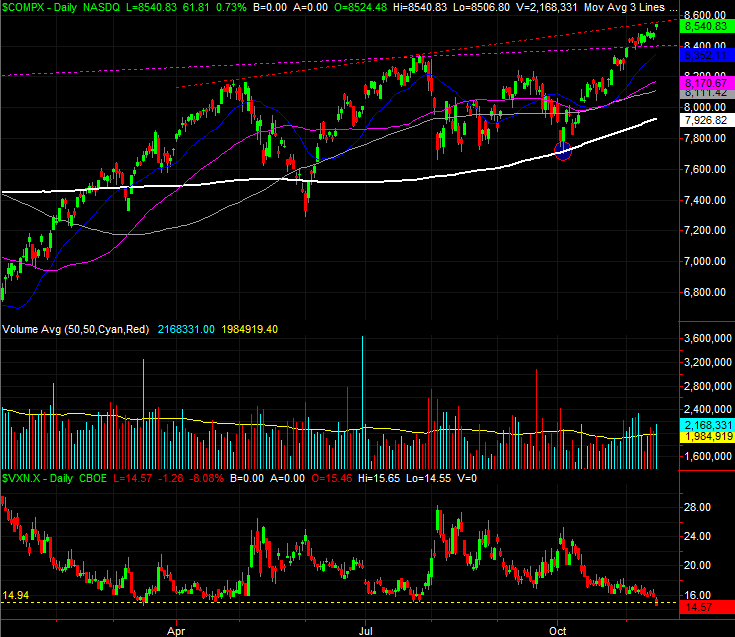
Source: TradeStation
Still, this is a bullish time of year, and the momentum is enticing. Be careful about leaning too bullishly -- blindly -- here though. Until Thursday, although the market was rallying, the rally was increasingly hollow.
The graphic below tells the tale. The daily NYSE volume peaked in late October, as did the NYSE's total advancers. Conversely, the exchange's total decliners were on the rise, as was its total bearish volume. The scaled tipped in the other direction beginning on Thursday, but one or two good days don't make or break a trend. Nevertheless, all trends start with that first step. It's just suspicious that the market was able to rally as well as it did for as long as it did with participation in that effort waning the whole time.
S&P 500 with Daily NYSE Advancers, Decliners, Up Volume, Down Volume
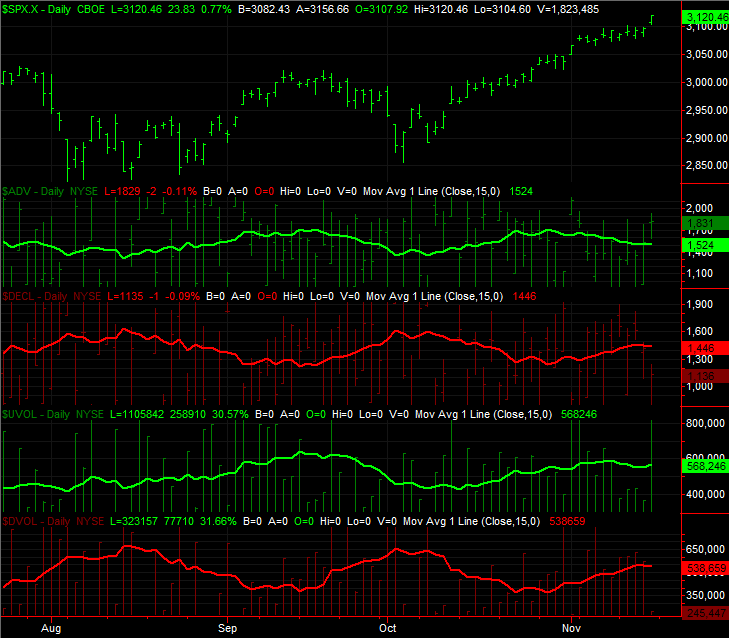
Source: TradeStation
It all makes this week a pivotal one, with the fans of volatility further flamed by a winding-down earnings season... and of course, more politics. The development (or lack thereof) of a trade truce between the U.S. and China is sure to stoke fires.
Traders seems to want to make sure a Santa Claus rally takes shape. But, the backdrop is less than ideal for that. If traders end up becoming disappointed, the overbought market could quickly and easily succumb to its current overbought condition.