Weekly Market Outlook - The Reason Stocks Were Up-Ended Doesn't Really Matter.

The market had one last good chance to stave off a September meltdown after Thursday's moderate losses. But, it blew it on Friday. That's when all the indices - for no obvious reason - made their moves below their key lines in the sand. Stocks were able to push up and off their intraday lows before the closing bell rang, but it just wasn't enough to undo the damage. Indeed, the fact that the indices didn't close right at Friday's lows in some ways further precludes the possibility of a quick recovery... maybe.
We'll look at the how and why in a moment. First though, let's run through last week's most important economic announcements, and preview what's coming this week.
Economic Data Analysis
It was a big, busy week last week in terms of economic news, with most of it being less than great (if not downright worrisome).
Case in point: Inflation. Economists were anticipating a measurable cooldown, but overall prices kicked unexpectedly higher. Consumers are paying 8.3% more for everything than they were a year earlier, and even with recent pullbacks in gas prices, the inflation rate (annualized) stands at 5.6%. Producers are still feeling plenty of pain as well. Their costs not counting the volatile prices of energy and food are 5.6% higher, and up 8.7% from year-earlier levels factoring in everything.
Consumer and Producer Inflation Rate Charts

Source: Bureau of Labor Statistics, TradeStation
This firm inflation report all but assures us the Fed will ratchet the Fed Funds Rate up the forecasted three-quarters of a point this coming week, when it has a scheduled chance to do so. Speaking of the Fed...
The Fed's capacity utilization and industrial productivity figures for August were ok, but not great. Utilization as well as industrial output actually fell from July's levels. Granted, the lulls were small and both data sets were already at oddly high readings. Nonetheless, the slowdown at this point in time is a red flag.
Capacity Utilization and Industrial Productivity Charts
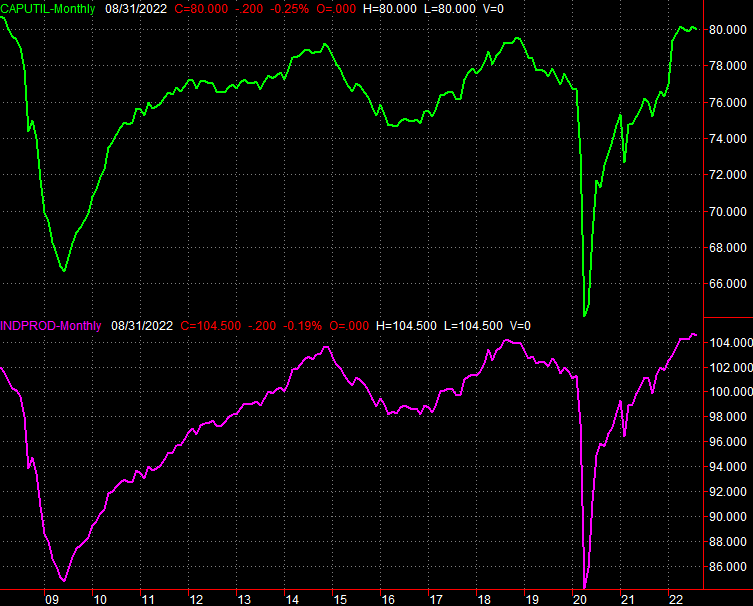
Source: Federal Reserve, TradeStation
Last but not least -- and in this same vein -- retail spending last month didn't grow nearly as well as hoped, and even contracted when taking automobiles out of the equation. It's not a stretch to suggest retail consumption has outright leveled off for the past couple of months now, which may be an omen of an outright contraction.
Retail Sales Charts
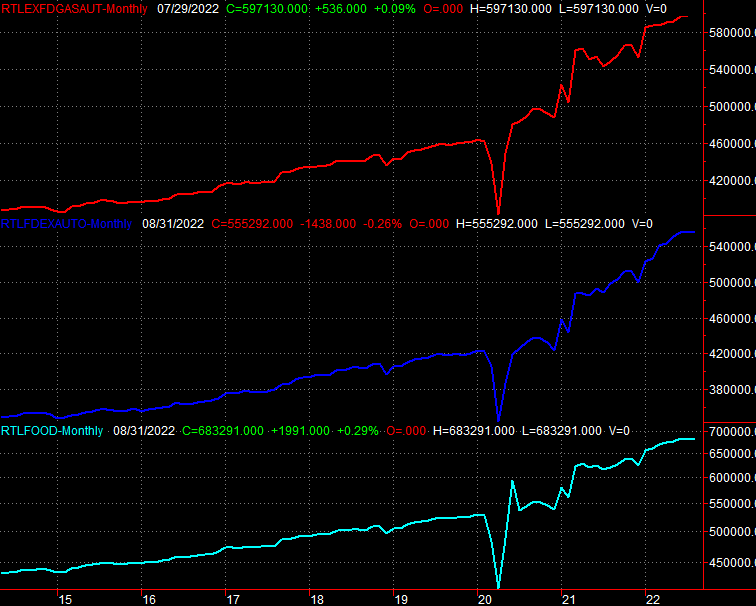
Source: Census Bureau, TradeStation
Everything else is on the grid.
Economic Calendar
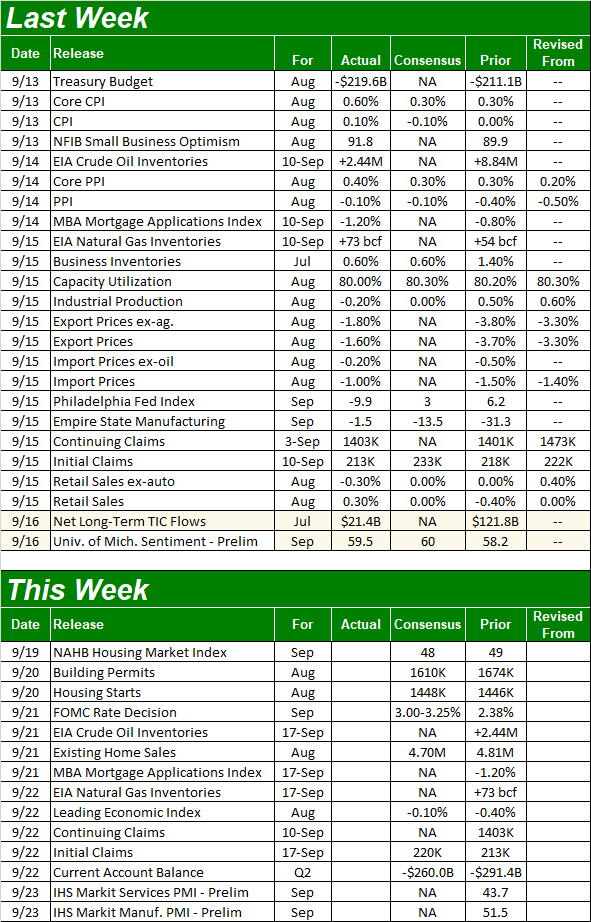
Source: Briefing.com
This week isn't quite as loaded, but it's a huge one for real estate data.
August's housing starts and building permits will be posted on Tuesday. Both are projected to roll in close to July's figures, though with a measurable dip in permits. Just bear in mind that July's figures were pretty lousy.
Housing Starts and Building Permits Charts
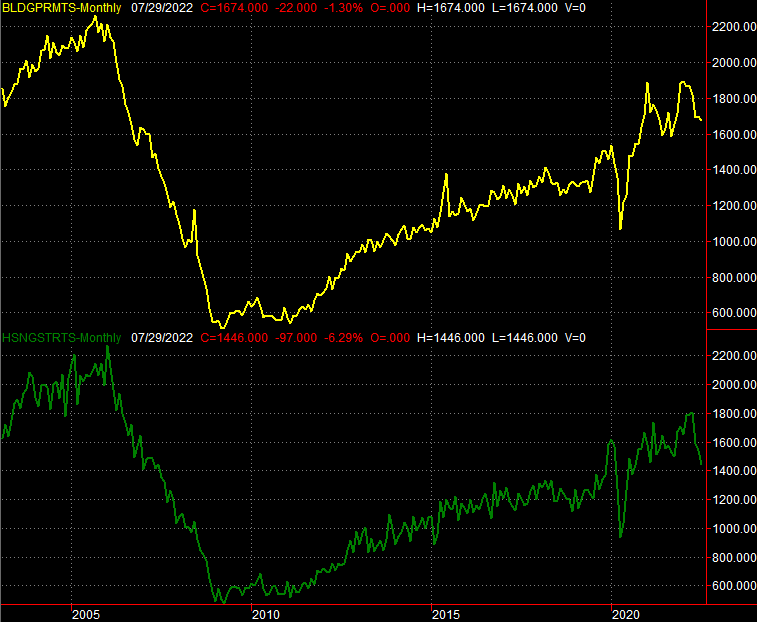
Source: Census Bureau, TradeStation
And, the National Association of Realtors will release home sales for August on Wednesday. As of the latest look economists are calling for an annualized pace of 4.7 million, down slightly from July's clip of 4.81 million. Like the starts and permits data though, that comparison is to a rather louse figure. Existing home sales fell to a two-year low last month, and would have been even lower were it not for pandemic-prompted shutdowns.
New, Existing Home Sales Charts
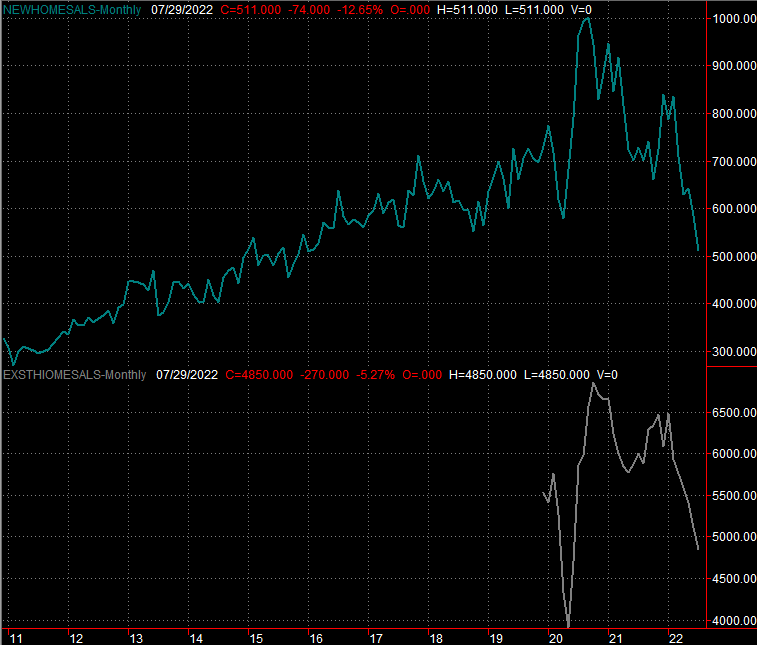
Source: Census Bureau, National Assoc. of Realtors, TradeStation
The new home sales report for August will be out next week, though don't look for any better results than the existing home sales figure's likely to be.
This week's Big Kahuna, of course, will be Tuesday's decision from the Federal Reserve regarding interest rates. As was noted, all signs point to a three-quarter point hike.
Stock Market Index Analysis
We mentioned at the website following Thursday's close that the stock market was on the verge of a key technical breakdown. That breakdown took shape on Friday. From here, stocks are on the defensive until they're clearly, decisively not.
Take a look at the daily chart of the S&P 500 below. As of Thursday the index had already fallen under the rising support line (green, dashed) that had been steering it higher since June's low. Friday's weakness pulled it below the horizontal support level at 3887 (blue) that was just starting to take shape, having served as an intraday low a couple of different times. With two key floors now snapped, there's very little keeping the index propped up now.
S&P 500 Daily Chart, with VIX and Volume
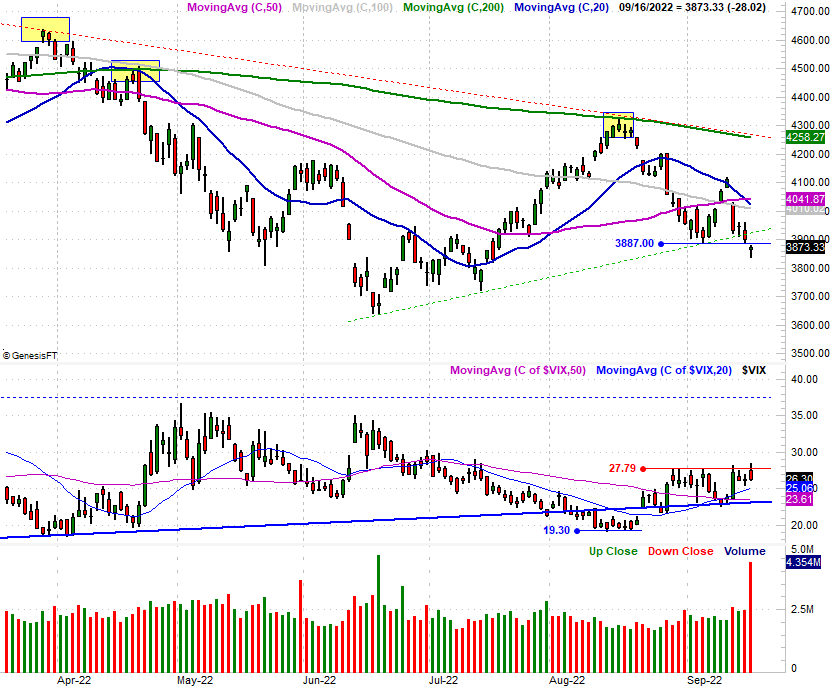
Source: TradeNavigator
There's one prospective escape for the market though, so to speak. The S&P 500's Volatility Index (VIX) didn't punch through its ceiling at 27.8. If traders were really going to convincingly push stocks into a sustained selloff, one would have expected to see that happen as well.
There's an explanation... sort of. Friday was not only an option-expiration day for the month, but was also an expiration day for the quarter. These days often force traders to make decisions regarding their option positions, which can also force significant buying and selling of stocks themselves. That's why we saw the volume surge. (You'll see a similar volume spike from June's option expiration day.) Indeed, this expiration wave could have arguably been one of the reasons stocks opened and closed in the red on Friday, yet also the reason the VIX didn't budge much.
Regardless, the damage done by Friday's tumble is damage all the same, in that it shakes investors' confidence in the market, and traders' psyches. The onus is now on the bulls to prove they're going to stave off the usual September swoon.
A look at the daily chart of the NASDAQ Composite, however, makes that seem like at least a possibility. It looks a lot like the S&P 500's daily chart, but the NASDAQ closed very near its intraday high on Friday. It's a signal that if nothing else, people were buying back into the market as Friday's closing bell approached. They may be on more of a bullish mood than it seems like they are on the surface.
NASDAQ Composite Daily Chart, with VXN
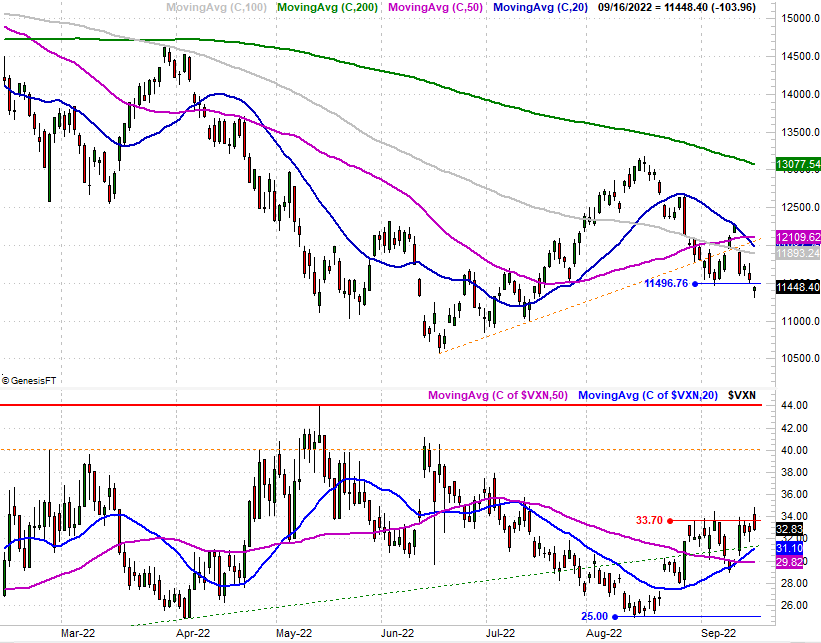
Source: TradeNavigator
Except, it may not matter.
As was noted, regardless of the reason, last week's selloff did some significant damage... to market values, and psyches. This damage may be worse than it seems just yet. The weekly chart of the S&P 500 illustrates way. Not only did stocks log a loss last week, but the S&P 500 formed a bearish "outside day" (or "outside week" in this case) reversal, where the week's open was above the previous week's high, and the close was below the previous week's low. These are also called bearish engulfing bars, as the latter week's move completely engulfs the first week's high/low range, reversing direction from one week to the next.
S&P 500 Weekly Chart, with VIX and Volume
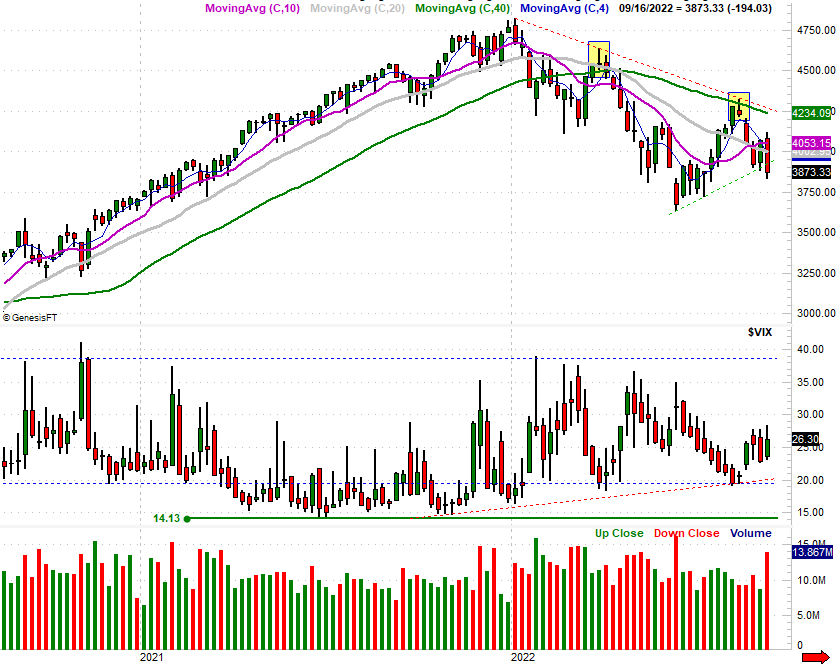
Source: TradeNavigator
In short, things could go either way here. How we start this week could make all the difference.
Food for thought: The best thing in the long run here could be a continuation of last week's weakness, bringing about the usual September/early-October capitulation that sets up the usual fourth-quarter rally. If we don't get that now (or at least soon), it could keep things choppy for the rest of the year while the market wrestles with finding its direction.