Weekly Market Outlook - The Market's Moving Higher Because Stocks are Rising
Another week, another winner, with the bulls seemingly picking up the pace. The S&P 500 logged more record highs, advancing just a little less than 2.0% for the five-day stretch.
The raw momentum is enticing, but this remains a dangerous situation. The market is overbought and ripe for a pullback, and only moving higher because investors are fearful they may miss out on more gains. Yes, it's enough for now. The question is, what might disrupt the rally long enough to give the would-be sellers an opening to get that ball rolling?
We'll look at the matter in detail below, after a rundown of last week's big economic news and a preview of this week's announcements.
Economic Data Analysis
A busy week indeed, starting with a look at the inflation picture. It's still tame, and even more so than expected. On a core basis, prices grew a mere 0.1% from November to December, translating into an annualized inflation rate 2.3%. It's been on the rise for months, but that rise still leaves inflation within the Fed's targeted range.
Consumer, Producer Inflation Charts
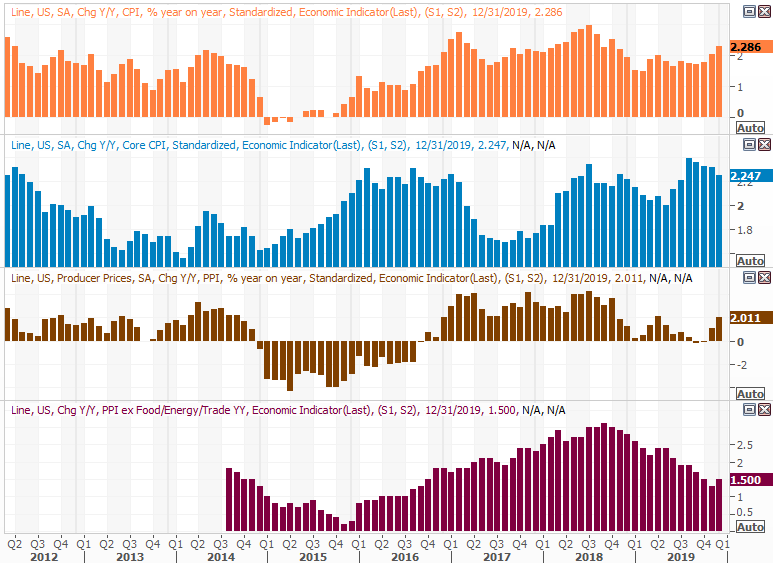
Source: Thomson Reuters Eikon
We also got December's retail sales figures late last week.... very impressive. The 0.7% improvement on November's tally meant a 5.8% year-over-year increase. That surge in spending came as a pleasant surprise after a couple of tepid months, but it also calls into question the year-ago data gathering. You'll recall retail spending reportedly crashed in December of 2018, leading some onlookers to conclude the economy was slowing to a grinding halt. There's been nothing to say the same since then. Last month's retail consumption surge may be exaggerated, but is still strong on an absolute basis.
Retail Sales Growth Charts
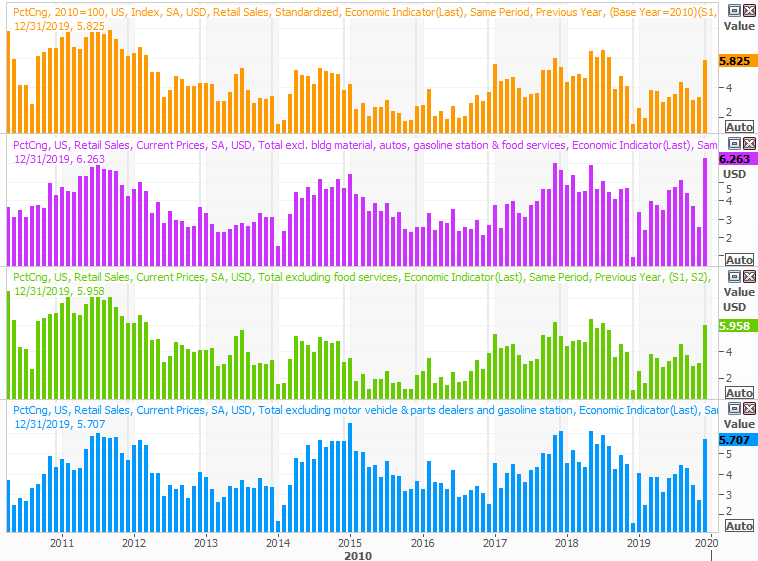
Source: Thomson Reuters Eikon
Bad news on the industrial side of the table though... industrial production fell 0.3% from November's activity, and capacity utilization fell from 77.2% to 77.0%. One slow month isn't devastating, but things have been poor for a few months now. We're not losing ground, but we're also not gaining the ground that a continually rising market says we should be. We need more manufacturing activity -- not just service activity.
Industrial Productivity, Capacity Utilization Charts
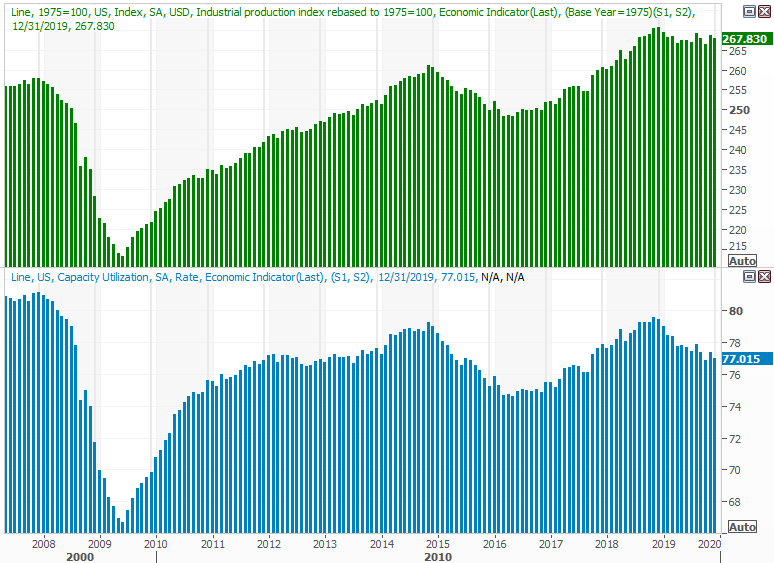
Source: Thomson Reuters Eikon
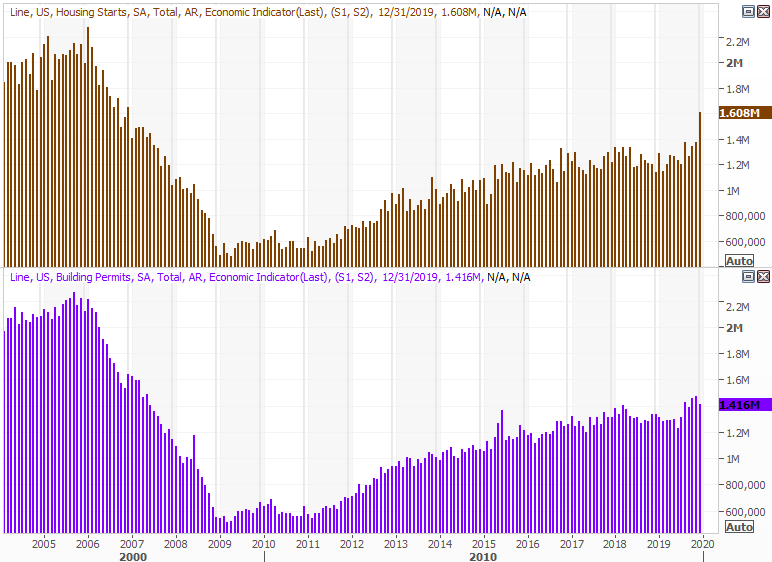
Finally, we saw a strong reading on building permits, and a huge swells of housing starts. An annualized figure of 1.6 million new homes broke ground in December, racing to a multi-year record and moving to levels not seen since 2007. It may have been a case of home buyers looking to get construction projects started while rates are still low, and before the end of the year. Still, it's a sign of strong demand that points to confident consumers.
Housing Starts, Building Permits Charts
Source: Thomson Reuters Eikon
Everything else is on the grid.
Economic Calendar
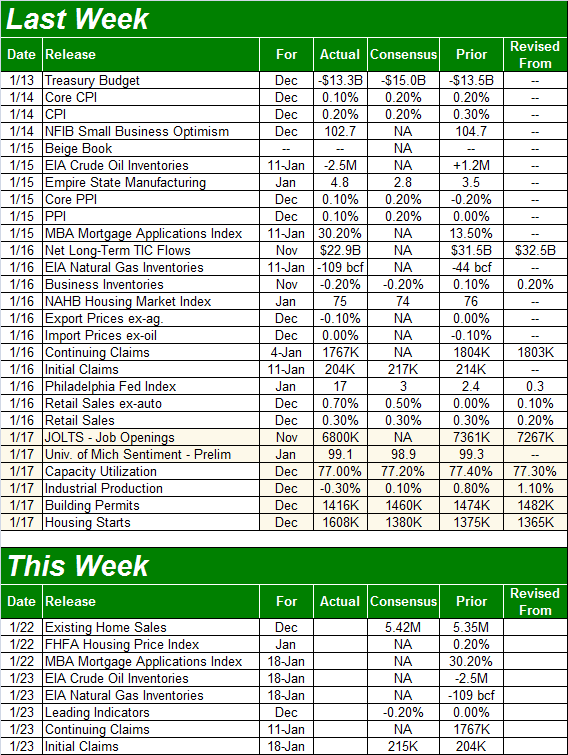
Source: Briefing.com
This week will be downright boring by comparison. There's only one item of real, urgent interest in fact. That's Wednesday's look at last month's existing home sales. Economists are expecting a slight rise, from 5.35 million to 5.42 million, though that won't be enough to a say a growth streak is in place... just enough to hold the market steady. Note on the same chart, however, that new home sales continue to trend higher. Also note that new home sales are trending higher as inventory swells, while existing home sales are flat on limited inventory.
New, Existing Home Sales with Inventory Levels
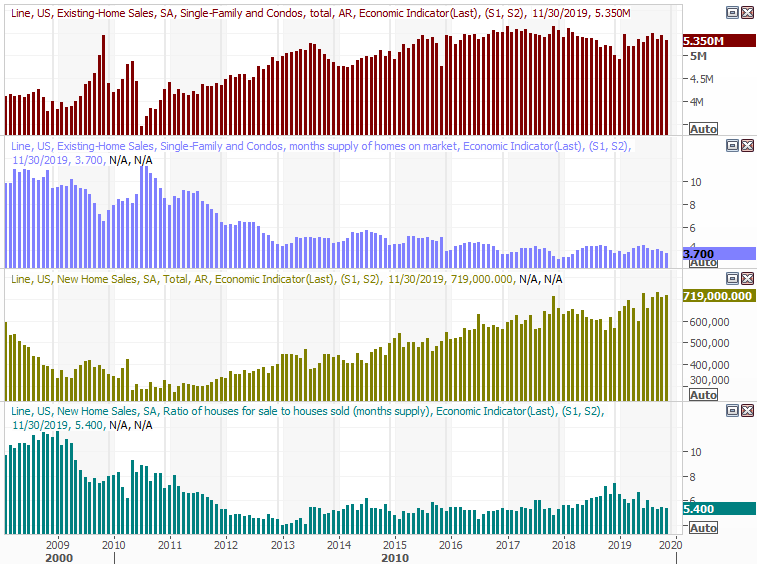
Source: Thomson Reuters Eikon
Finally, it's not exactly a barn-burner, but given that there's so little else going on this week, keep your eyes open for crude oil inventory levels on Thursday. It's been sliding lower for several weeks now, though that hasn't helped buoy prices much.
Crude Oil, Natural Gas Stockpile Inventory Levels
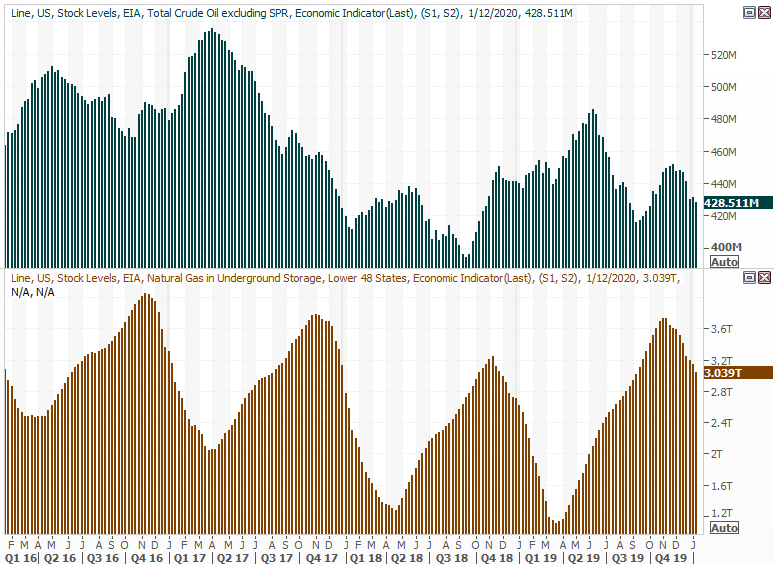
Source: Thomson Reuters Eikon
Stock Market Index Analysis
To say "the market's moving higher because stocks are rising" sound ridiculous on the surface. Yet, it's actually an accurate assessment of what's in play. But, first things first.
We'll begin this week's analysis a with a broad look at the weekly chart of the S&P 500, just to put the scope of the rally since October in perspective. This has all been highly unusual, though the bulls remain unwilling to yield. As the same chart also cautions though, such rallies can stop and turn on a dime and unwind in a big way.
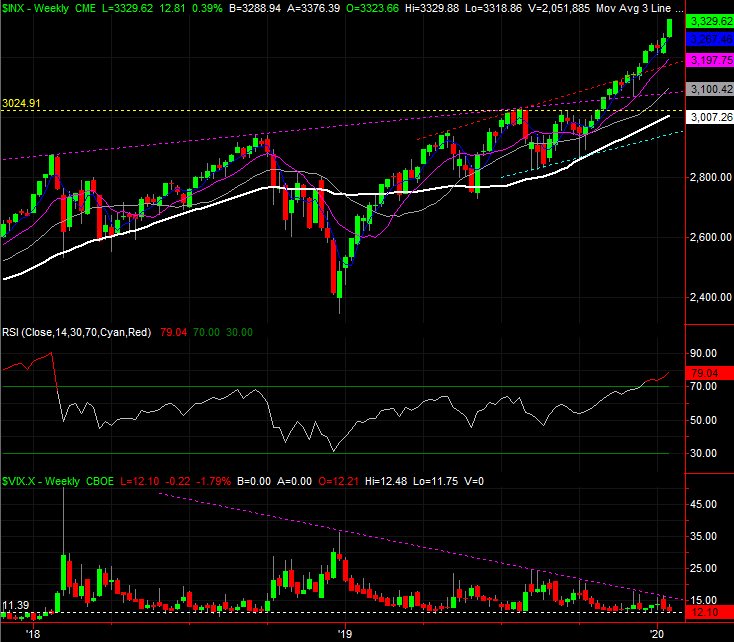
Source: TradeStation
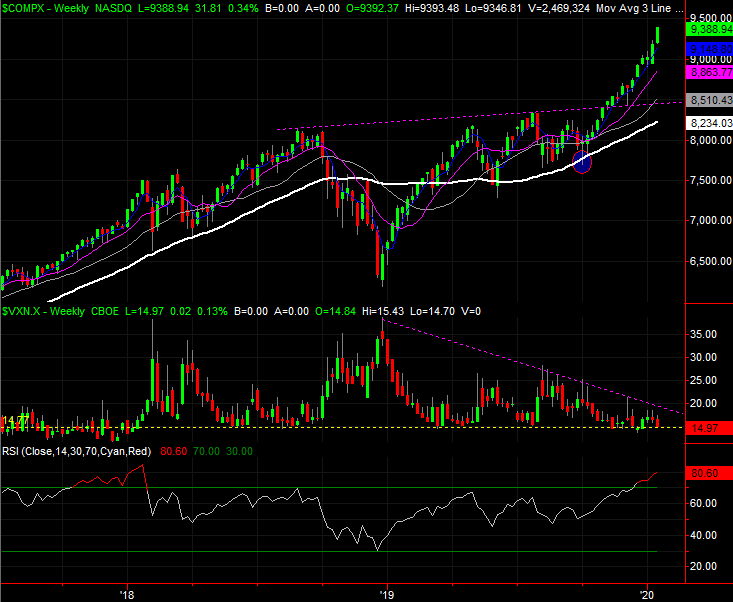
Same story for the NASDAQ Composite, though more intensely. With last week's 2.3% advance, the tech-heavy composite is now up a whopping 22% from its October low. That's an extreme in more ways than one, not the least of which is the degree of divergence from its 200-day moving average line (white) at 8234. It's now 14% above the long-term indicator. For comparison, it never got more than 15% above its 200-day average in 2018... when it was on a major roll.
NASDAQ Composite Weekly Chart, with VXN and RSI
Source: TradeStation
Also note the NASDAQ's volatility index, the VXN, has fallen back to what's become a pretty strong support area just under 15.0. That doesn't necessarily mean a correction is imminent. The VXN could simply waffle around its current levels while the market continues to inch higher, as we saw happen in the middle of 2018. In the same vein, just because the market is overbought doesn't inherently mean it has to pull back now. It's been overbought for a while, and hasn't stopped yet.
Just for the record though, each day the march forward continues is another day that takes shape against ever-worsening odds.
To that end, a zoomed-in view of the daily charts make it fairly clear what will serve as an official signal that the overdue correction has begun. For the S&P 500, it will have to start with a break below the 20-day moving average line (blue) currently at 3254. Anything less than that, and we still have to give the benefit of the doubt to the bulls. And even then, a tumble below the 50-day moving average line (purple) will be necessary to confirm more downside is brewing.
Yet, even that won't necessarily be a major red flag. We'll still want to see the pivot take shape with a clear, pivotal bar. That is to say, the shape of the bar that comes right before the first big "down" day should be a doji, or what's often called a spinning top. That's or at least a huge intraday swing for the worst.
S&P 500 Daily Chart, with VIX and Volume
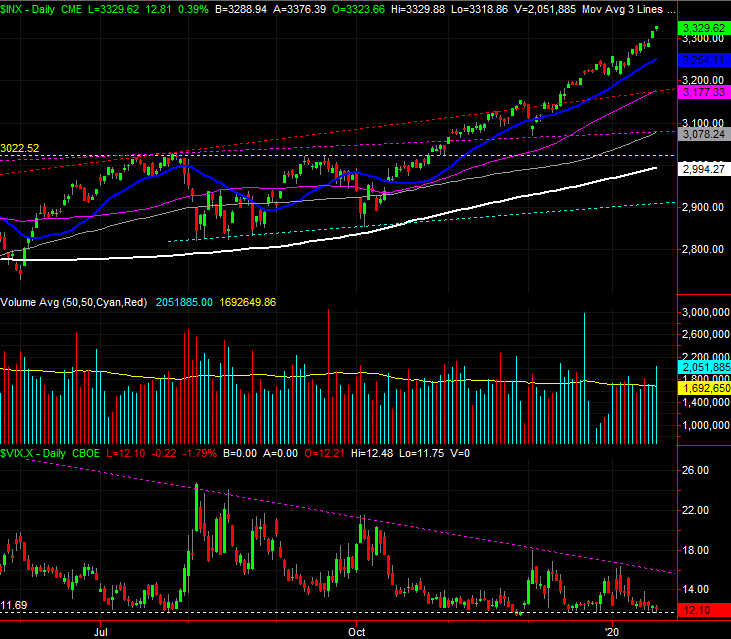
Source: TradeStation
More than anything though, we're keeping a close eye on the VIX (and VXN) foe evidence that the tide has finally taken a turn for the worst. The market has been kind enough to draw a clear technical ceiling for the VIX (purple, dashed) that will need to be hurdled if stocks are going to stumble into any real trouble. Anything less than that, and even a little weakness may be palatable.
Unfortunately for the market, there's little wiggle room left between where the VIX is and that ceiling, currently just below 15.0.