Weekly Market Outlook - The Market Just Got Over the Hump... Mostly
For a short while on Friday it looked like the week's budding rally effort was going to stall out. When push came to shove late in the session though, the bulls stepped up. While not every index cleared every possible hurdle, most of the indices have now cleared most of their most critical hurdles.
That's not a guarantee of a full-blown recovery from the bear market. It's still possible stocks could take a turn for the worst again. From an odds-making perspective though, the bulls have to like their odds a whole lot better than they did just a few days ago.
We'll take a detailed look at things below. First, let's recap last week's economic news and preview the biggies on the schedule for this week. Spoiler alert: There's a ton of stuff in the lineup that could move the market, including Friday's jobs report for January.
Economic Data Analysis
We got lots of data last week, although not much of it was particularly noteworthy. So, we'll stick to the highlights, starting with December's sales of new homes. They were up a bit from November's levels, although the bigger trend is still pointed lower. And, as we saw a couple weeks back, sales of existing homes are plummeting.
New, Existing Home Sales Charts
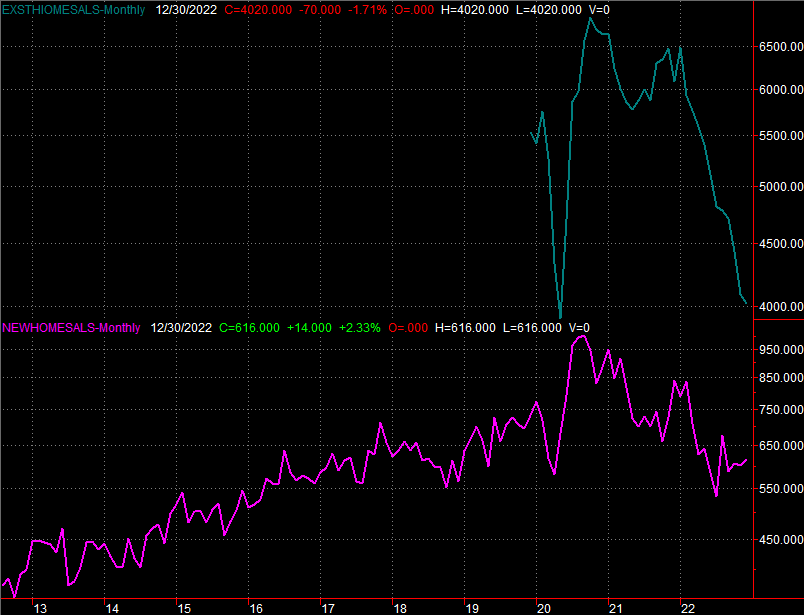
Source: National Assoc. of Realtors, Census Bureau, TradeStation
Although we're not plotting a chart of it, know that last quarter's GDP growth rate fell to 2.9%.
Lastly, January's third and final reading of the University of Michigan Sentiment Index pushed its way sharply higher from the big plunge suffered around the middle of last year.
Consumer Sentiment Charts
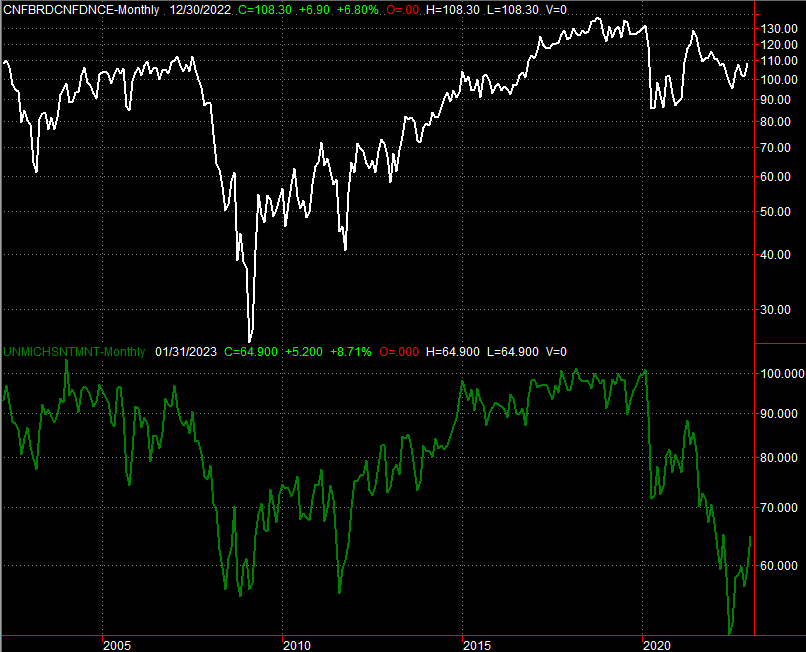
Source: University of Michigan, Conference Board, TradeStation
The Conference Board's consumer confidence reading for this month is due on Tuesday of this week. Economists are calling for a slight pullback, though it still appears the index is trying to snap back from the same lull the University of Michigan Sentiment Index ran into last year. Either way, a lackluster report on Tuesday could be a problem for the broad market.
Everything else is on the grid.
Economic Calendar
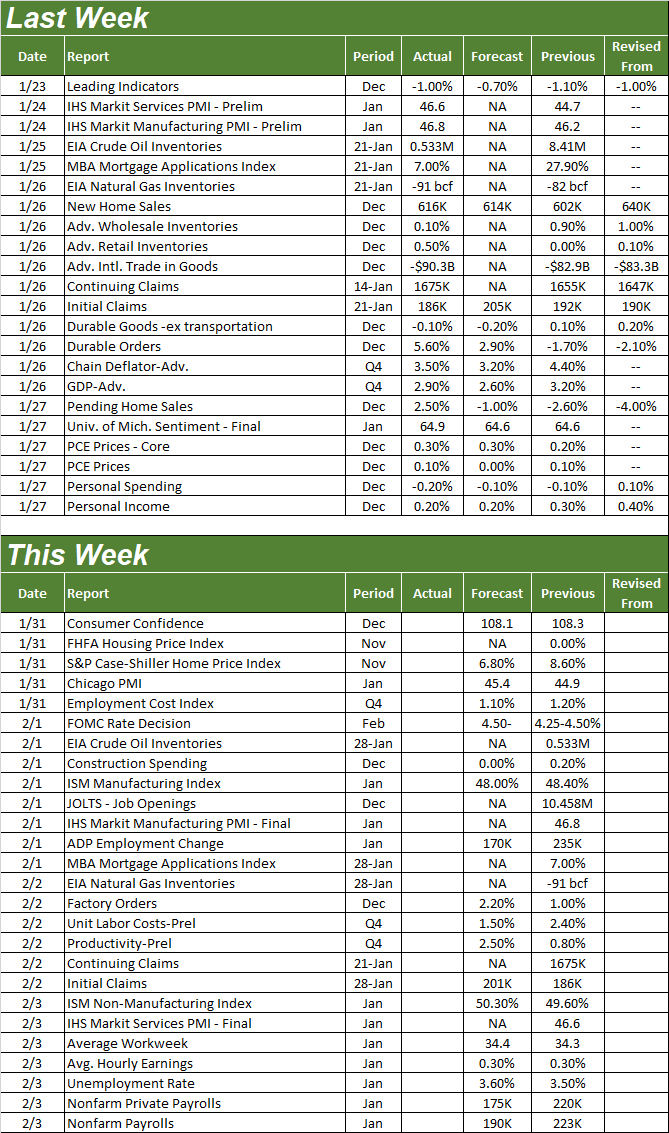
Source: Briefing.com
The real estate picture will be rounded out this week with an update of both key pricing indexes. Namely, November's S&P Case-Shiller Home Price Index as well as the FHFA Housing Price Index will be dropped on Tuesday. Each has been inching lower since the middle of last year, and that weakness isn't apt to let up when we get the next round of updated figures.
Home Price Index Charts
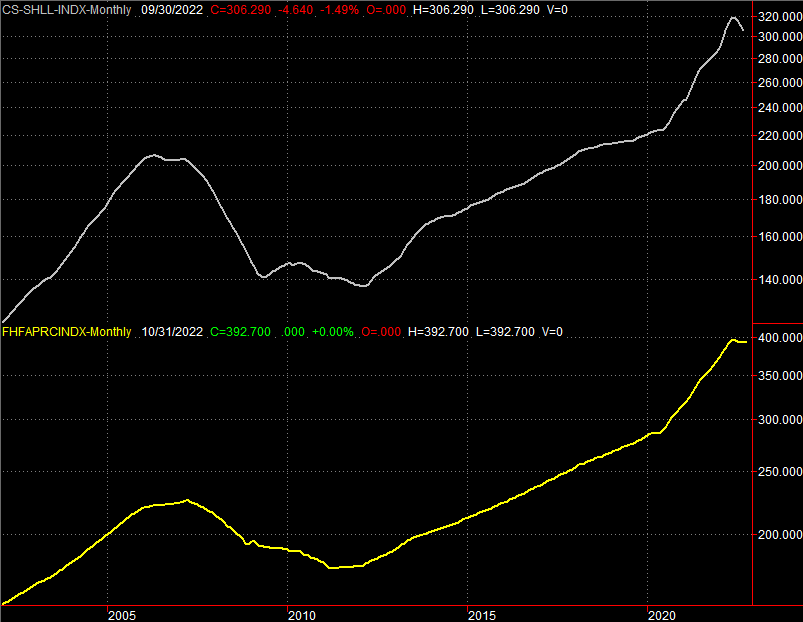
Source: Standard & Poor's, FHFA, TradeStation
On Wednesday look for the ISM Manufacturing Index, followed by Friday's ISM Services Index update. Each of these metrics has been in a freefall for several months now. While this weakness is projected to slow for January, it's certainly not reversing course just yet.
ISM Services, Manufacturing Index Charts
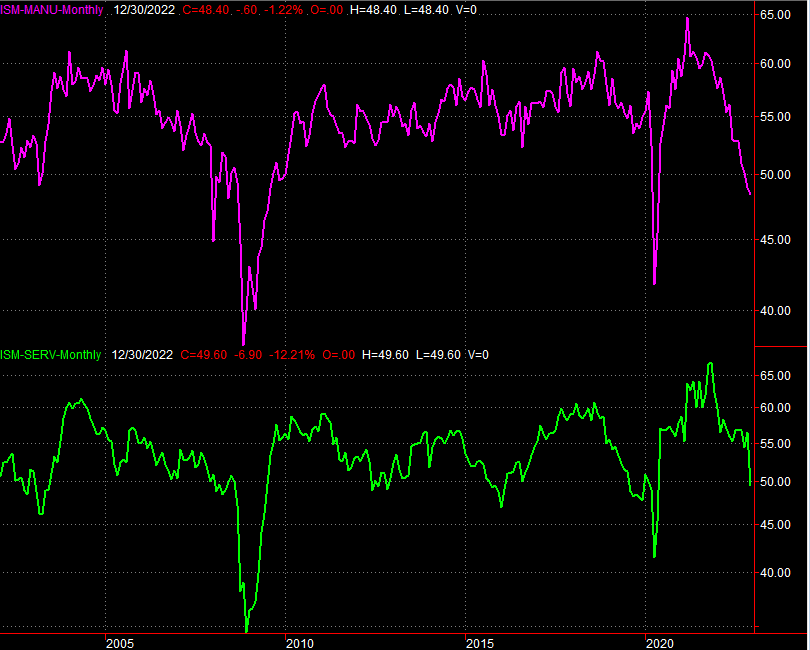
Source: Institute of Supply Management, TradeStation
This week's big Kahuna, of course, is Friday's jobs report. It could be trouble. Forecasters are looking for a more modest improvement of 190,000 new jobs versus December's pace of 223,000, which should be tepid enough to let the unemployment rate edge up from 3.5% to 3.6%. That's still relatively healthy on an absolute basis, but this isn't when and how we want to start showing any economic weakness.
Payroll Growth, Unemployment Rate Charts
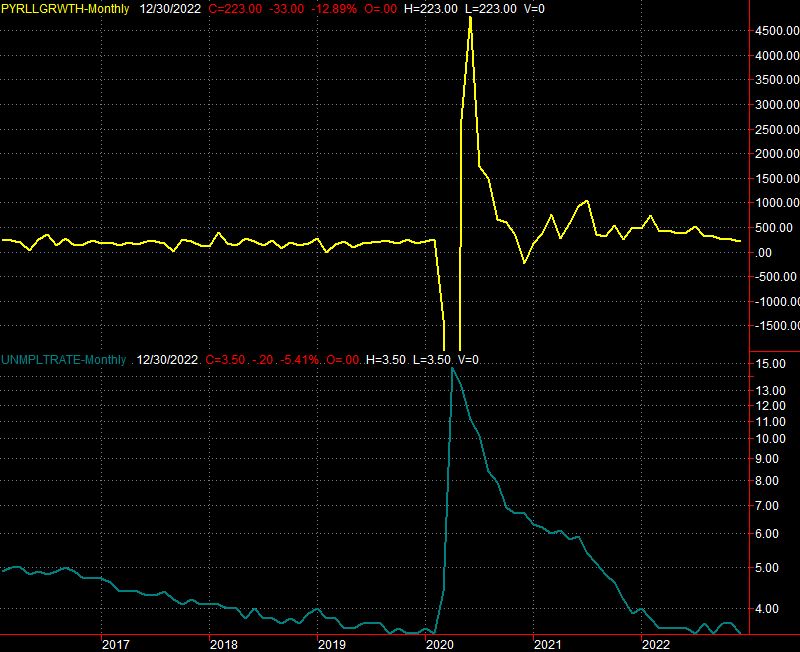
Source: Institute of Supply Management, TradeStation
Stock Market Index Analysis
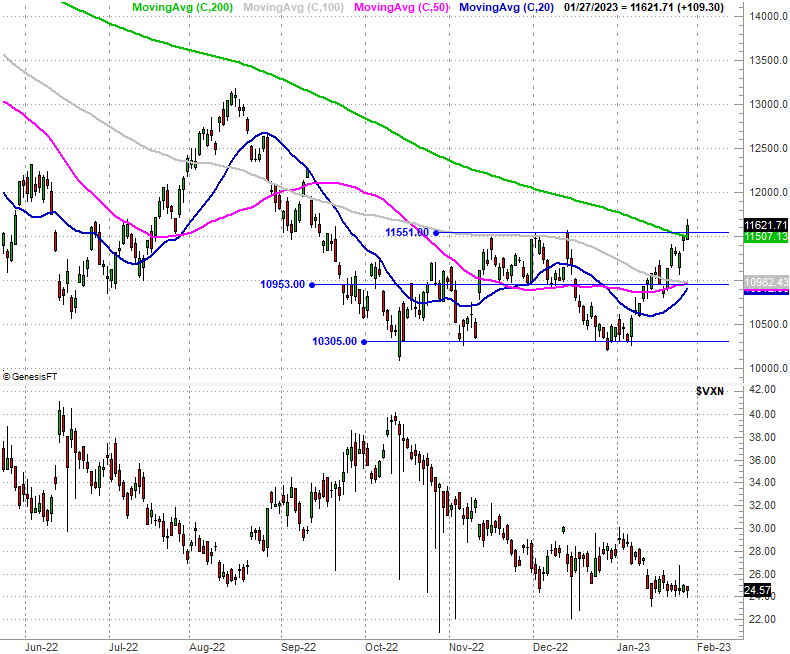
For the fourth week in a row stocks made forward progress. Last week, however, was the most important weekly gain... at least for the NASDAQ Composite. Take a look. On Friday, the index finally punched its way back above the 200-day moving average line (green) as well as the recent horizontal ceiling at 11,552. This is the most net progress the composite has made since late-2021, when the NASDAQ began what would eventually turn into a full-blown bear market.
NASDAQ Composite Daily Chart, with VXN
Source: TradeNavigator
Here's the weekly chart of the NASDAQ Composite for a little added perspective. From this vantage point we can better see the upward "rounding" of the index, with a double-bottom being made at 10,190. Also notice how all the moving averages are converging after a major divergence. The selling has not only slowed down, but is clearly turning back into sustained net-bullish progress. Also take note of how the volatility index (VXN) is testing support at the floor near 24.6. That's bullish... or at least hinting at bullishness.
NASDAQ Composite Weekly Chart, with VXN
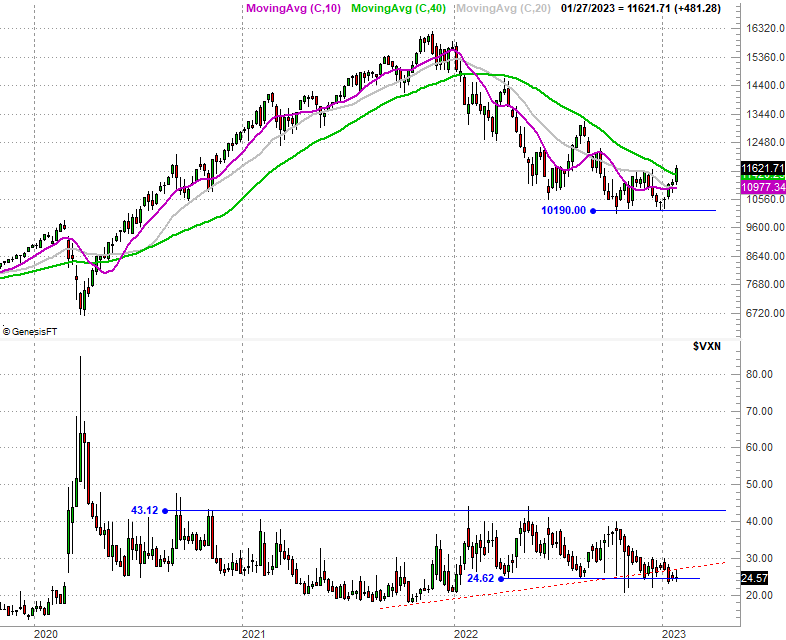
Source: TradeNavigator
Here's the weekly chart of the S&P 500, which is similarly bullish for different reasons. In this case the index had already broken above the falling resistance line (red, dashed) that had been steering it lower since the beginning of last year. But, it put some more distance between itself and that resistance last week.
S&P 500 Weekly Chart, with VIX and Volume
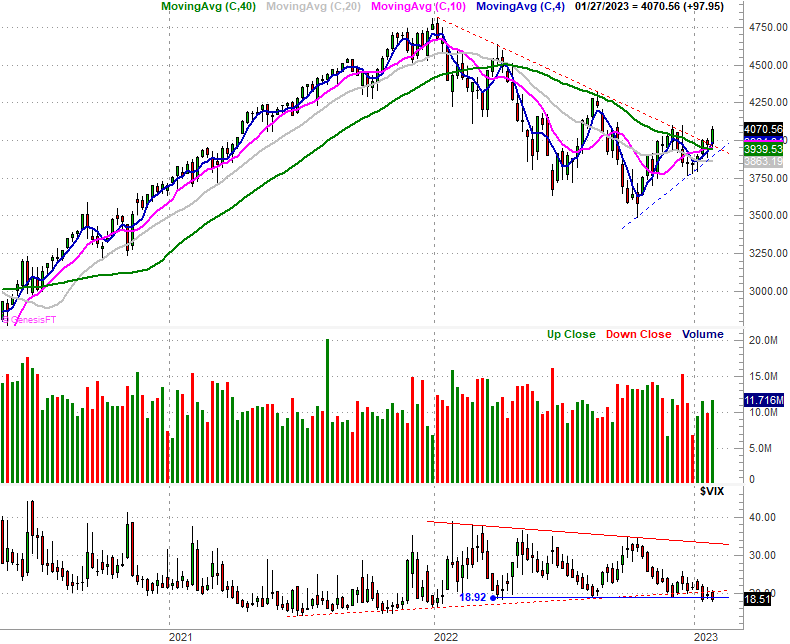
Source: TradeNavigator
Zooming into the daily chart of the S&P 500 gives us another interesting, bullish detail about the market's budding rebound effort. That is, the 50-day moving average is close to making its way back above the 200-day moving average line... a "golden cross" that suggests the bigger-picture tide has turned bullish. On the flipside, note that the S&P 500 didn't make its way back above December's horizontal ceiling at 4096. Breaking above that level would clinch this sweeping technical bullish clue.
S&P 500 Daily Chart, with VIX and Volume
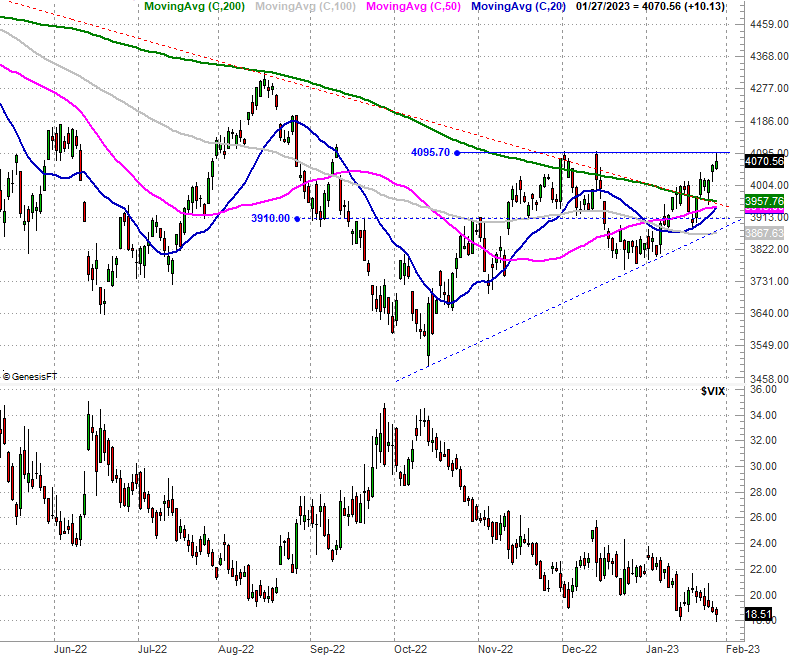
Source: TradeNavigator
This is bullish -- there's no denying that. Just remember this market is fickle, and there's plenty of opportunity in the immediate future for traders to get spooked. There's a lot of economic data in the lineup for this week, and we're now in the heart of earnings season. It's still possible for something to pull the rug out from underneath the market.
Also bear in mind that breakouts are more of a process than an event. It's also just as possible the bulls could take a break here and let stocks peel back just a bit and then rekindle this bullish effort. The S&P 500's convergence of several moving average lines around 3950 is an ideal landing/support level for any pullback, re-launching the rally effort.
We'll just have to wait and see how things shape up from here. What we do know is that it's still a bit too soon to jump to any major conclusions.