Weekly Market Outlook - The Buying Stopped When the Going Got Tough
Stocks got off to an amazingly good start last week, easily bouncing back from the previous week's drubbing that left the market on the brink of a major technical breakdown. But, when the S&P 500 had a chance late in the week to decisively plow into new-high territory, the bulls just weren't ready.
The buyers may be able to regroup this week, try again, and get the market back in a bullish groove. Stocks are certainly not past the point of no return. But, nobody needs to be making any huge commitments just yet. Another small stumble could still prove catastrophic.
We'll look at where the new lines in the sand are below, and detail what it will take to push the key indices back into decisive uptrend. First, however, let's run down last week's big economic announcements and preview what's on the agenda for this week.
Economic Data Analysis
Yes, last week's big news was January's jobs report, although there was plenty of noteworthy news before we got to that Friday release. Early in the week, for instance, we got last month's auto sales figures... though they didn't exactly impress. The annualized pace of 17.3 million was up a bit from December's clip thanks to better truck sales and despite weaker passenger car sales. The bigger trend, however, remains a shallow decline.
Auto Sales Charts
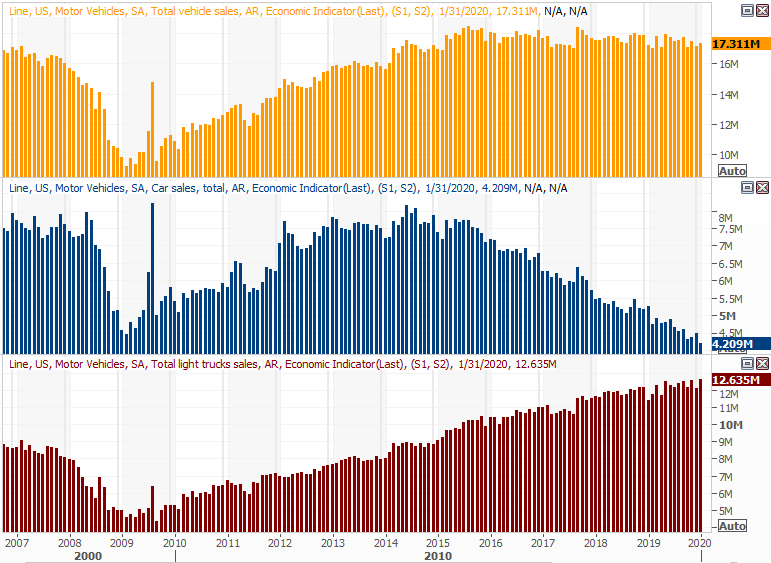
Source: Thomson Reuters Eikon
We also got both ISM reports last week... manufacturing, and services. Both showed forward progress -- more than was expected -- and more important, the manufacturing index popped back above the pivotal 50 level. One good month doesn't make or break a trend, but it's a start.
ISM Index Charts

Source: Thomson Reuters Eikon
As for the employment report though, while the unemployment rate ticked higher in January, it was for a positive reason. The numbers: The unemployment rate increased from 3.5% to 3.6%, but 225,000 payrolls were added to the mix.
Payroll Growth, Unemployment Rate Charts
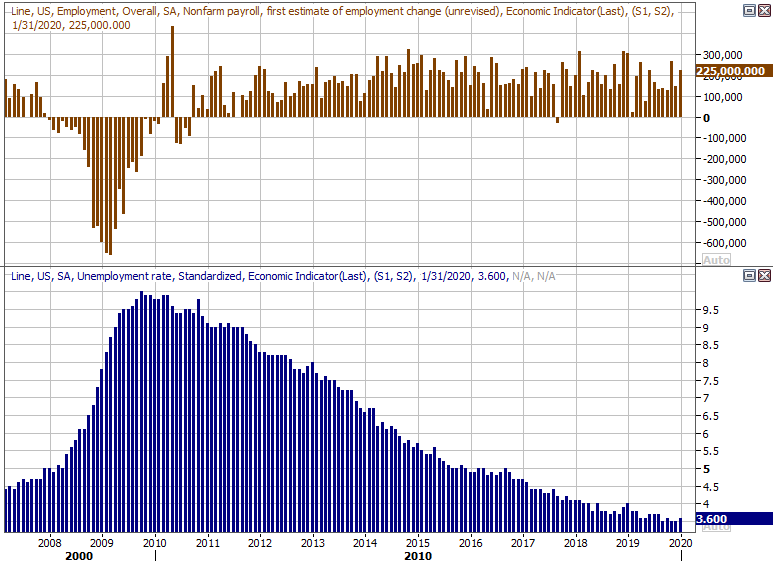
Source: Thomson Reuters Eikon
We explain why it's actually all good news at the website, here: https://www.bigtrends.com/education/markets/how-the-unemployment-rate-rose-despite-strong-job-growth-in-january
Everything else is on the grid.
Economic Calendar
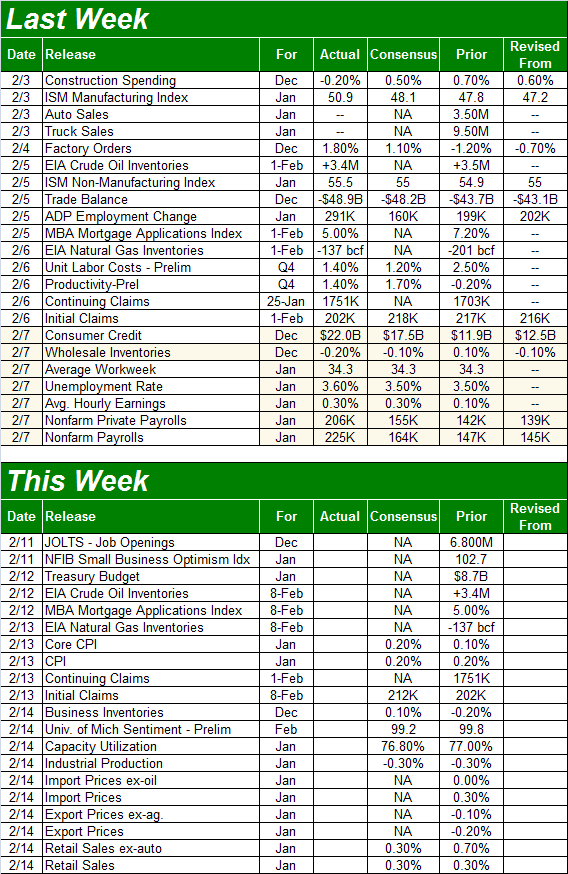
Source: Briefing.com
This week is going to be another busy one, but there are only three items on our radar... inflation, industrial activity, and retail sales.
The inflation picture will be fleshed out on Thursday with last month's consumer inflation report, though producer inflation won't be reported until next week. Even so, the 0.2% increase expected from December's consumer prices is palatable, and leaves the Fed room to be accommodative.
Consumer, Producer Inflation Charts
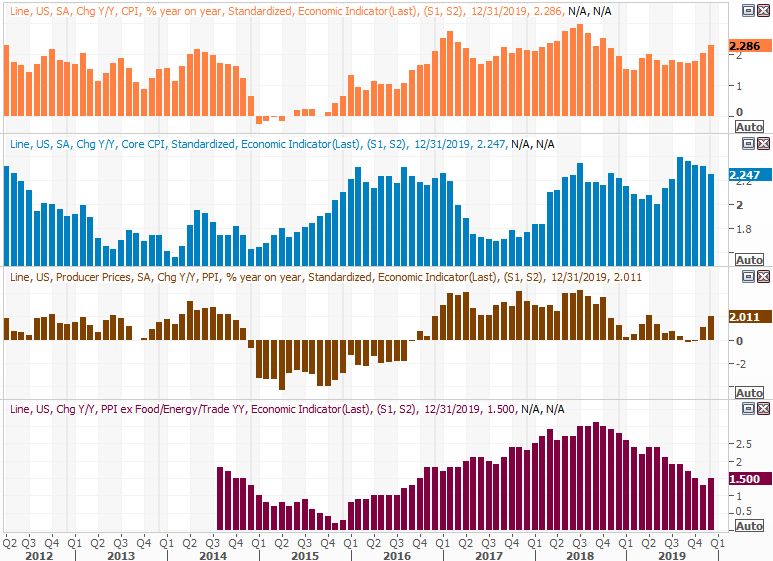
Source: Thomson Reuters Eikon
Notice the annualized inflation rate now stands at a very palatable 2.3%, though it's starting to move into uncomfortable territory because of oil and food prices. The good news is, those two costs are the most likely to slide lower.
One Friday we'll hear about January's industrial production and capacity utilization... arguably the two measures that correlate the most with the market's long-term trend, and corporate earnings. Each has been weak for a few months, although each has also shown glimmers of hope since late last year. Unfortunately, economists think industrial activity slumped last month (although that outlook doesn't jibe with the ISM data, or employment figures).
Industrial Production, Capacity Utilization Charts
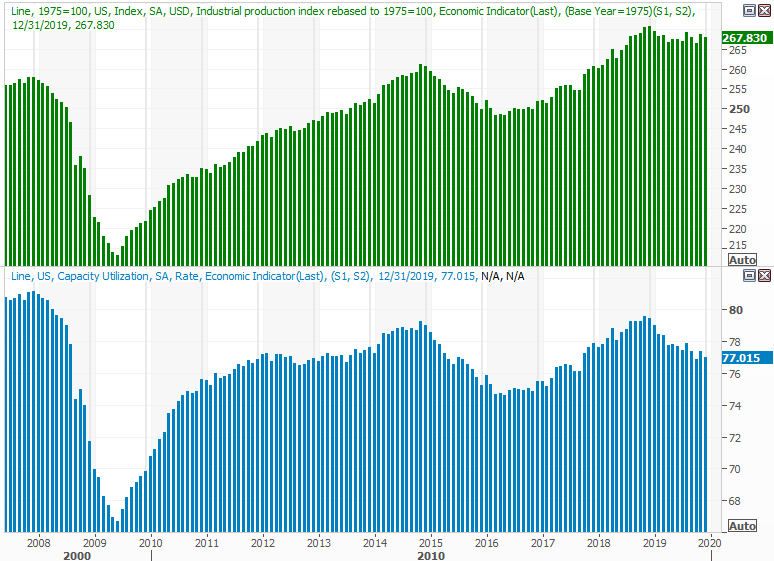
Source: Thomson Reuters Eikon
Of course, the pessimistic outlook opens the door to a potential pleasant surprise.
Finally, also on Friday we'll hear January's retail sales report. The pros are looking for another strong spending wave following strong holiday spending, reflective of solid consumer confidence. While the overall economy may have some sore spots, consumer consumption isn't one of them. Indeed, it's been a reliable bright spot.
Retail Sales Charts
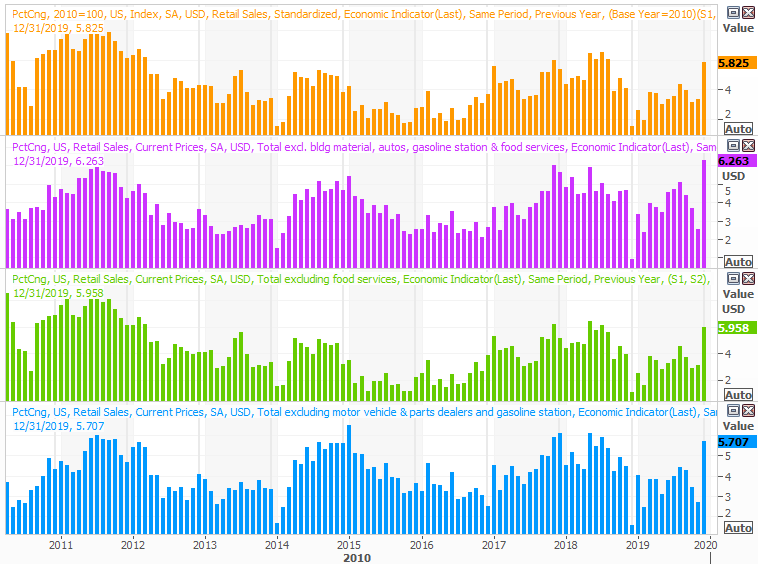
Source: Thomson Reuters Eikon
Stock Market Index Analysis
We mentioned a week ago that the sheer speed of the previous week's pullback set the stage for a rebound... one that may or may not last. The perfect kiss of the 50-day moving average line (purple) two Friday's ago added to the prospect a knee-jerk bounce, with the provision of a technical support level. Like clockwork, the market did bounce, with the S&P 500 barely reaching another record high on Thursday.
S&P 500 Daily Chart, with VIX and Volume
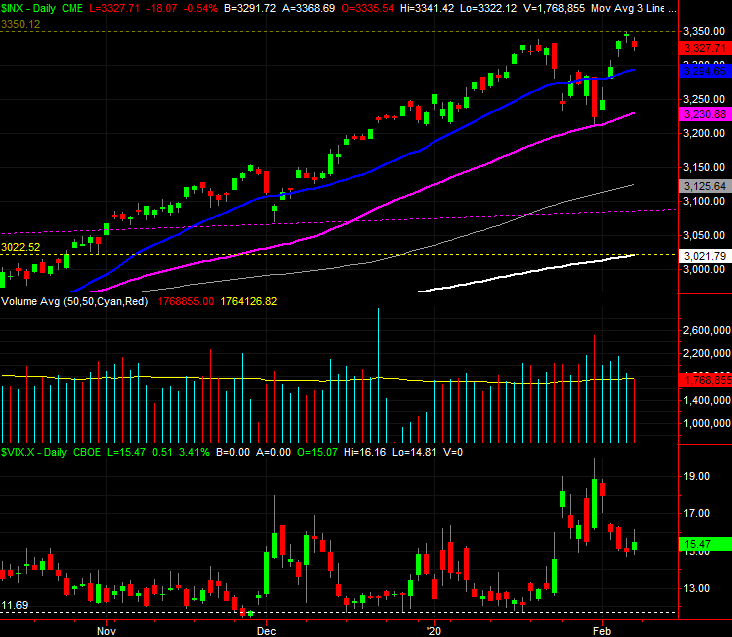
Source: TradeStation
As we also cautioned a week ago, however, a quick bounceback isn't necessarily evidence that higher highs await. In fact, several clues suggest we're actually positioned to make lower lows again. And this time, the market may end up breaking under the 50-day moving average line that held it up two Friday's back. Underscoring the potential for a pullback is the two bullish gaps left behind with Tuesday's and Wednesday's gains. Investors tend not to leave gaps unfilled.
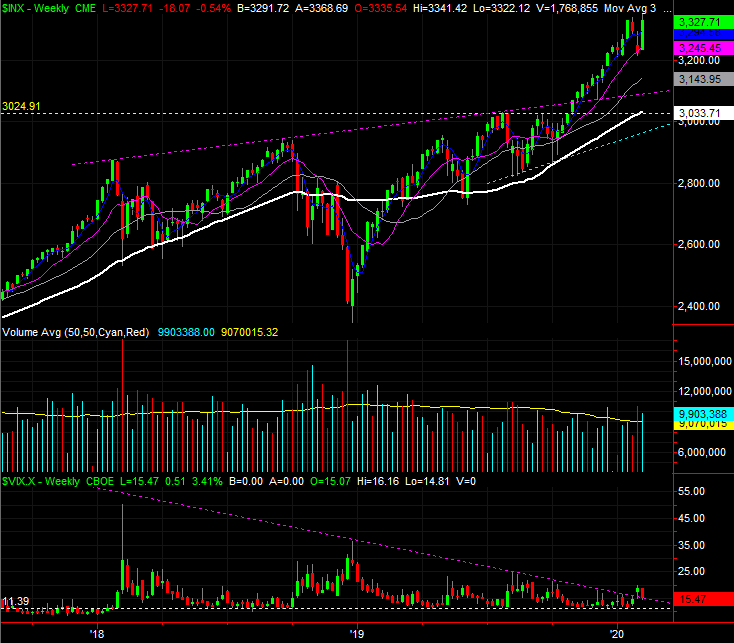
The weekly chart of the S&P 500 below puts things in perspective in terms of how overbought the market is at this time, although it also delivers a slight hint that the undertow is actually still bullish. Namely, even with Friday's lull, last week was a big win, extending what's become weeks' worth of established momentum. It's what's on the other hand that bolsters the bearish case. That's how far the S&P 500 has come since December of 2018, the lack of volume behind last week's advance, and the VIX has punched above the falling ceiling that had been guiding it lower since late-2018.
S&P 500 Weekly Chart, with VIX and Volume
Source: TradeStation
And the lack of bullish volume -- or lack of volume behind the market's gainers -- isn't just a gut feeling. Even with Tuesday's and Wednesday's gains seeing above average volume to the upside (the amount of shares traded with shares that logged a gain those days), it wasn't wildly greater volume, and it neither persisted nor broke the downtrend of bullish volume that's been in place since late last year (UVOL). Conversely, the NYSE's bearish volume (UVOL) has clearly been trending higher since late last year, even though stocks have somehow still managed to drift upward during that period.
NYSE Up, Down Volume Daily Chart, with S&P 500
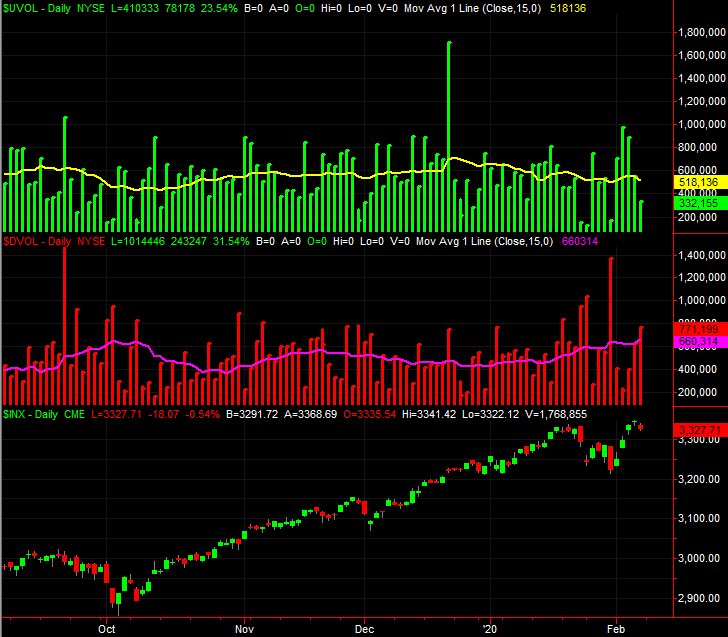
Source: TradeStation
This continues to be our key issue for this rally, though it hasn't seemed to bother anyone else yet... the buyers in particular. There don't seem to by many of them, but there's still more of them then there are sellers. The bears may be unwilling to do their thing here, having been burned too many times in the recent past by betting against a market that's unwilling to go down. Every news item of development that was an opportunity to buoy stocks has been interpreted in the best possible light, spurring indiscriminate buying. The music will stop sometime and leave somebody without a chair, but it clearly hasn't stopped yet.
Ditto for the NASDAQ Composite, by the way. The composite hit a new high on Wednesday, but immediately started to fade. There was never much volume behind the move. Notice the VXN has also broken above its long-standing technical ceiling.
NASDAQ Composite Daily Chart, with VXN and Volume

Source: TradeStation
The bottom line is, this week will be a test. The weight of the gains since October are still bearing down. That hasn't been enough to matter yet, but that prospect still looms above. They key remains what happens at the 50-day moving average line (and for the NASDAQ, there's also a rising technical support line in play right around there). There's wiggle room for a little weakness, but not a lot.