Weekly Market Outlook - The Bulls Have One Last Chance to Stave Off a Selloff
 Yikes. Though a glimmer of hope started to shine on Friday after Thursday's meltdown, that effort gave way. With Friday's small loss on top of Thursday's huge one, the stock market just suffered its worst two-week stretch since June of 2016. Perhaps worse, the S&P 500 suffered some technical damage we haven't seen in weeks... a red flag of change we can't afford to ignore. Never even mind the fact that we're headed into the toughest time of year for the market.
We'll assess the damage and the potential below, as we always do. First though, let's look at last week's and this week's economic news, which is still ultimately doing the driving for the market.
Economic Data
Last week was loaded up with news, beginning with Tuesday's retail sales report for July. They were good.... much better than expected. They were up 0.6% month-to-month overall, and grew 0.5% on a month-to-month basis when taking auto sales out of the equation. On a year-over-year basis, we're still seeing growth rates at or above 3.0% for most stratifications.
Retail Sales Growth (Annualized) Charts
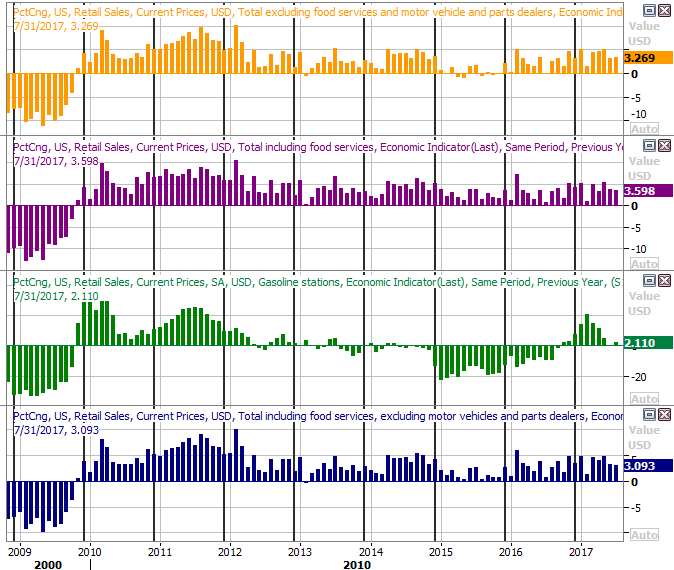
Source: Thomson Reuters Eikon
On Wednesday we heard July's housing starts and building permits. They weren't bad, but they weren't as strong as hoped. Starts of 1.115 million fell short of the expected annual pace of 1.217 million, while permits rolled in at an annualized pace of 1.223 million compared to estimates of 1.247 million. Both reading were also down from June's pace.
Housing Starts and Building Permits Charts
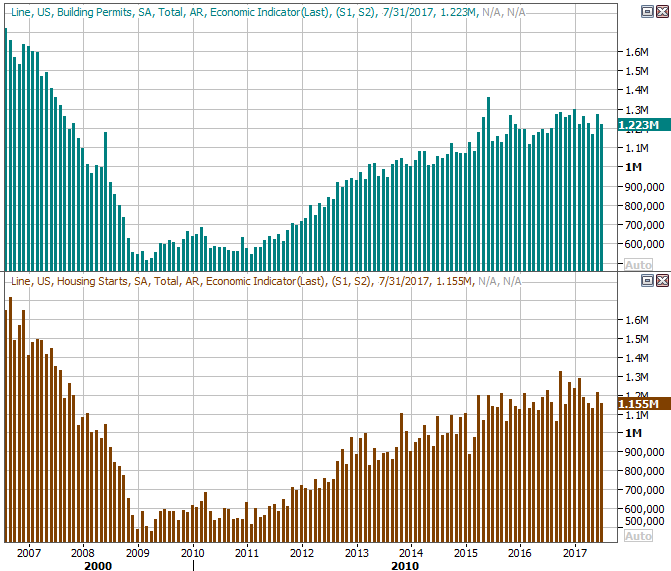
Source: Thomson Reuters Eikon
The once-red-hot housing market has been cooling off of late. June's strong surge offered a glimmer of hope that the growth pace would move back to its strong growth pace seen between 2011 and 2015. Last month's lull once again suggests starts and permits are going to level off.
Finally, on Thursday we heard about last month's capacity utilization and industrial productivity. Both had been decisively trending higher since the middle of last year, and they're still moving up. The upward trajectory slowed last month though (although economists largely expected the headwind).
Capacity Utilization and Industrial Production Charts
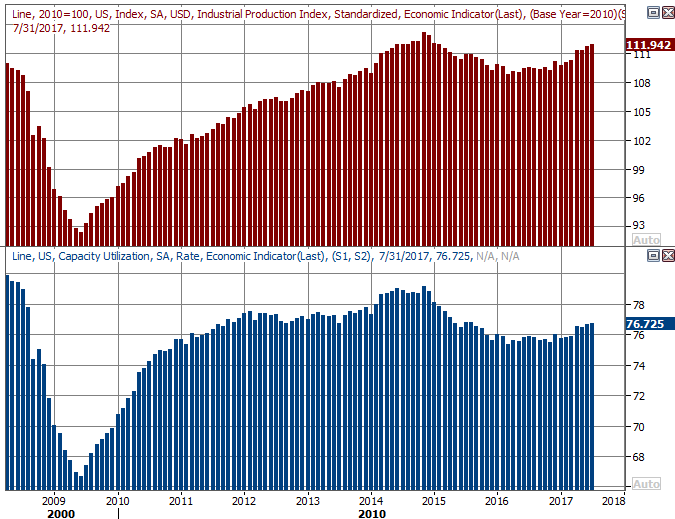
Source: Thomson Reuters Eikon
Still, you have to like the bigger-picture undertow here. The link between the long-term market trend and corporate earnings and industrial productivity is a pretty right one, so the trend here says we're still in a bull market.
Everything else is on the grid.
Economic Calendar
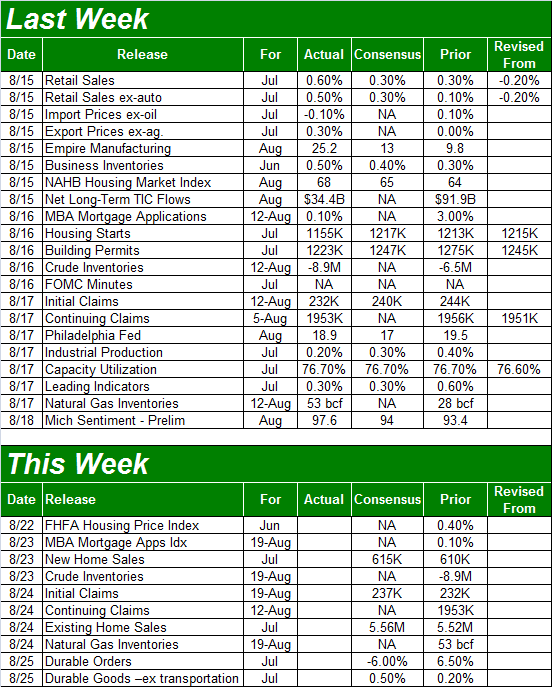
Source: Briefing.com
This week is going to be an oddly uneventful one. In fact, the only item of interest will come on the real estate front. July's new home sales will be unveiled on Wednesday, and existing home sales will be announced on Thursday. Economists are looking for modest improvements for both compared to June's levels. As was the case with building permits and housing starts, it looks like the pace of sales are slowing to a standstill.
New and Existing Home Sales Charts
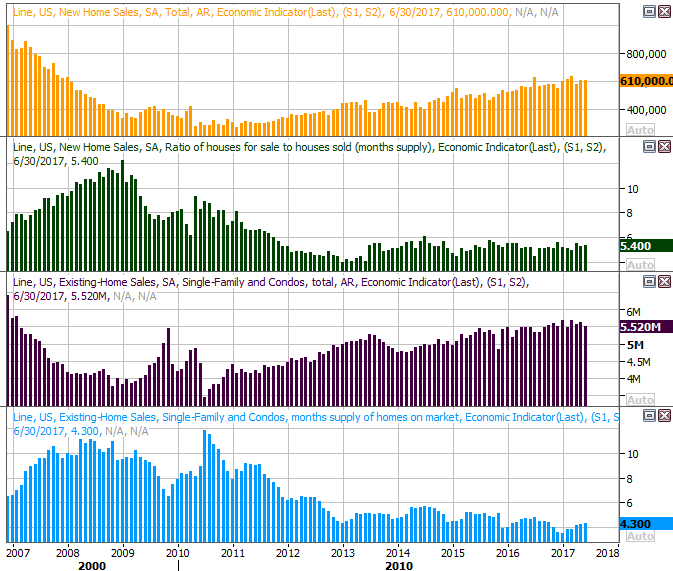
Source: Thomson Reuters Eikon
Though in some ways a lack of inventory may have kept home sales growth at bay since the economic rebound began in 2010, it didn't prevent purchases from gradually increasing. Should we start to see inventory start to edge meaningfully higher going forward without corresponding growth in sales, that may well be a sign that the supply/demand balance is tipping in a weak direction.
That's not where we are right now, but that possibility is on the radar after a long streak of increased purchase activity despite a limited selection of available homes.
Index Analysis
It wouldn't be accurate to say the market is beyond salvaging at this point, despite the worst two-week stretch in months being logged during the middle of August. But, it would be accurate to say we're now closer to an outright implosion than we've been since early November.... when investors were prepping for a selloff inspired by a Trump victory.
The daily chart of the S&P 500 makes this idea pretty clear. In addition to the move under the 50-day moving average line (purple) to a degree we've not seen in months, the index is now below the lower 20-day Bollinger band rather than supported at it. You can also see the Volatility Index (VIX) is once again on the verge of breaking above a technical ceiling around 16.3. So far the resistance has held the VIX in check, but the bears keep chipping away. This time may be the breaking point.
S&P 500 Daily Chart
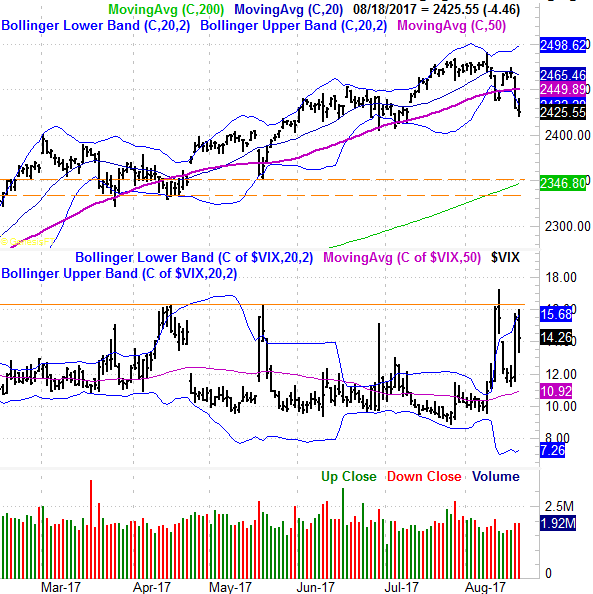
Source: TradeNavigator
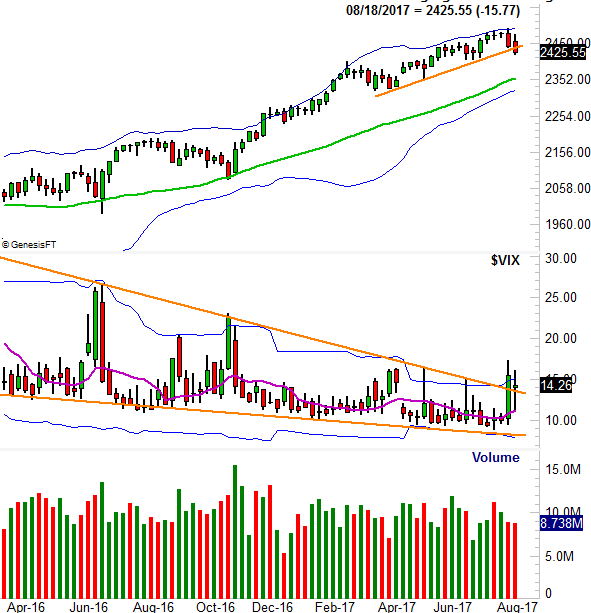
Zooming out to a weekly chart of the S&P 500 doesn't tell us anything we don't already know. As is usually the case though, it does offer us some much needed perspective on where we are and how we got here. We haven't been through a healthy correction -- a correction that touched the 200-day moving average line (green) -- since early November, and we can also see that the S&P 500 has broken below a near-term support level. It's also clear in this chart that the VIX has broken out of a converging wedge pattern that's been squeezing it in since early 2016. Things DID change the past two weeks.
S&P 500 Weekly Chart
Source: TradeNavigator
The NASDAQ Composite is in the same boat. That is to say, the recent weakness has been more damaging than other pullbacks have been, and the NASDAQ's Volatility Index (VXN) is testing waters it hasn't tested in a long, long while.
NASDAQ Composite Weekly Chart
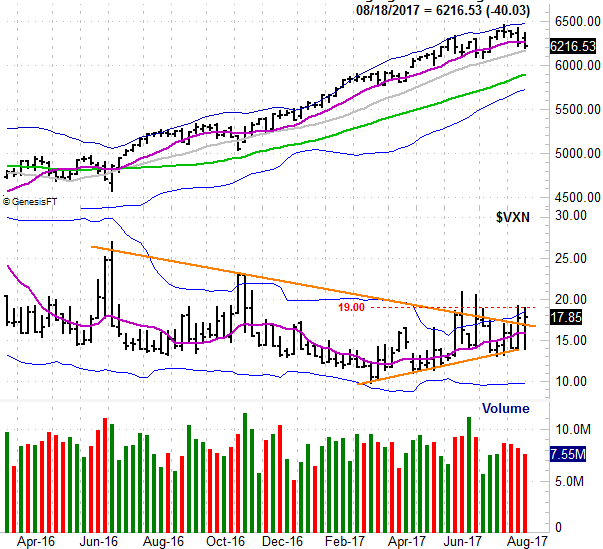
Source: TradeNavigator
For the market to reach the point of no return, the NASDAQ Composite needs to break under the 6182 level and the VXN needs to close above 19.0 on a weekly basis. For the S&P 500, the make-or-break floor is... well, it's already been broken, though the VIX will need to clear 16.3 ceiling before we can say the tide has turned fully bearish.
Let's not forget that the usual September weakness usually begins in mid-August, with the losing a total of 1.2%, on average, from peak to the early-October trough. On the other hand, let's also not forget traders have been willing to bullishly defy the odds plenty of late, even when things looked wobbly.
In other words, the matter is still undecided. At least we have some clear lines in the sand though.