Weekly Market Outlook - The Bulls Flinched, And In a Big Way
What started out as another good week for the market -- a third straight week of gains that could have rekindled the bigger bullish trend -- didn't end that way. It didn't even come close to ending that way. Rather, when push came to shove as the week wound down, it was the sellers doing all the shoving.
The market's not too far gone to recover without suffering a full-blown reflection, mind you. There's still some hope. The odds are certainly against stocks at this point though. The bears inflicted a sizeable amount of technical damage last week, and more of this damage is just one bad day away.
We'll take a look at these dents and dings below, as we always do. First though, let's look at last week's economic reports and preview what's coming for this week.
Economic Data Analysis
There wasn't a lot of economic news to process last week. But, what little we did get was monumentally important... and bad. That is, January's consumer inflation rate reached another multi-decade high. Last month's prices are 7.5% higher than they were a year ago, and even on a core (ex-food and gas) basis inflation stands at a multi-decade high of 6.0%.
Inflation Rate (Annualized) Charts
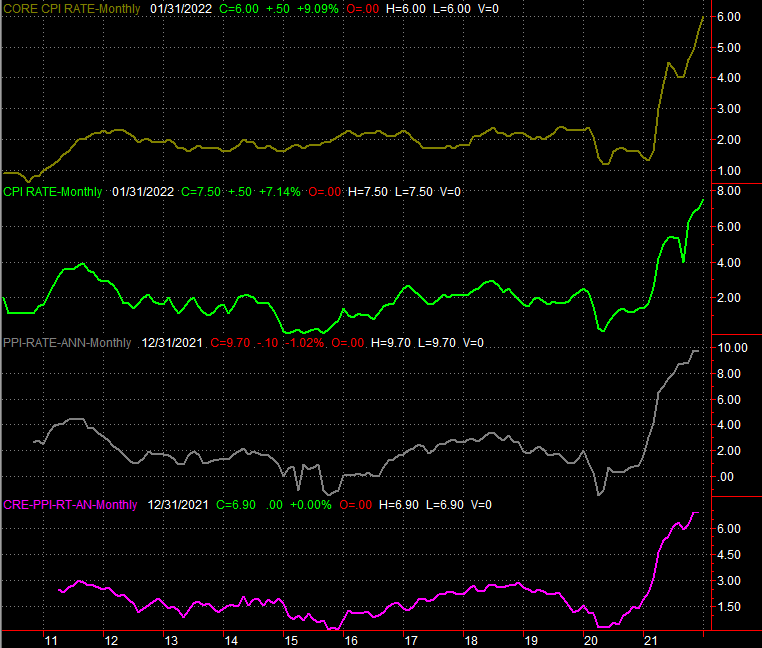
Source: Bureau of Labor Statistics, TradeStation
January's producer inflation figures are due this week. Given the consumer inflation data in-hand, don't look for good news on that front. It's arguable that Thursday's release of these numbers is the key reason stocks tanked that day, and continued to tumble on Friday.
Everything else is on the grid.
Economic Calendar
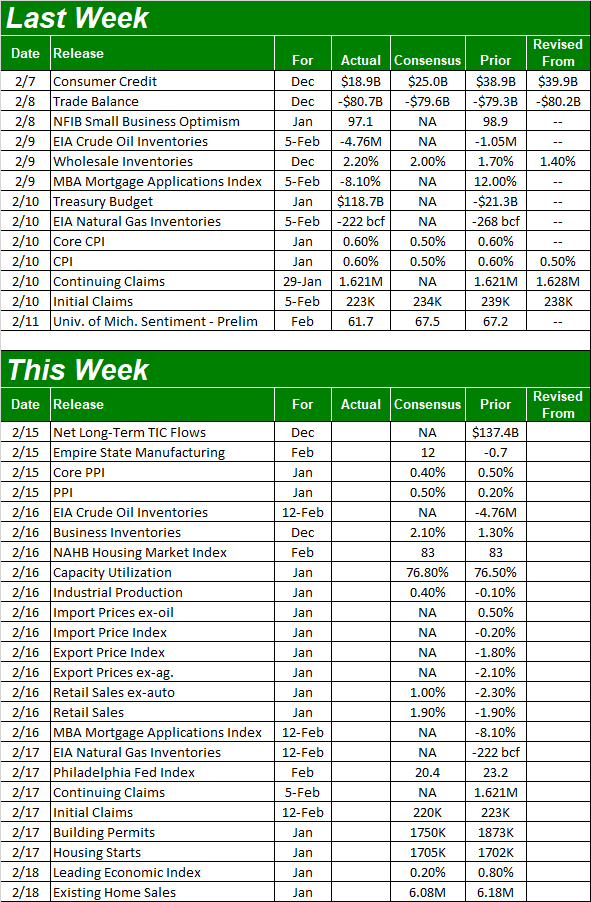
Source: Briefing.com
In addition to producer inflation rates, this week's going to give us some other key economic data... particularly on the real estate front. Before that though (yet after Tuesday's producer inflation data), look for the Fed's capacity utilization and industrial productivity report on Wednesday. Economists are calling for slight improvements after December's lull, but things have been slowing down for some time now. It will take more than one good month to reignite these much-needed uptrends.
Capacity Utilization and Industrial Productivity Charts
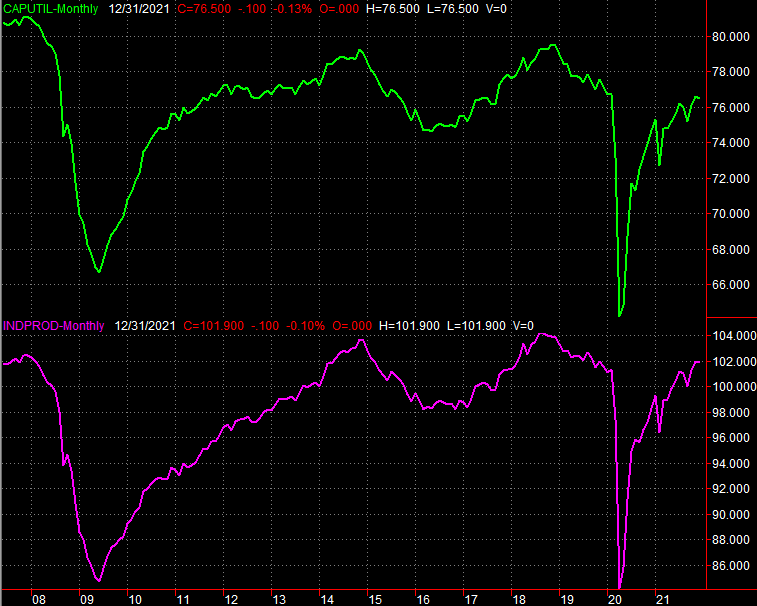
Source: Federal Reserve, TradeStation
Also on Wednesday look for last month's retail sales report. The pros are modeling rekindled growth following December's sizeable setback, but that growth won't offset December's dip. Even so, the bigger-picture spending trend remains bullish.
Retail Sales Charts
Source: Census Bureau, TradeStation
On Thursday we'll hear last month's building permits and housing starts. Look for starts to march December's levels, and plan for a noticeable lull in permits issued. But, don't sweat what looks like softness from either figure. Both trends are still going strong, and December's issued permits were particularly overdone.
Housing Starts and Building Permits Charts
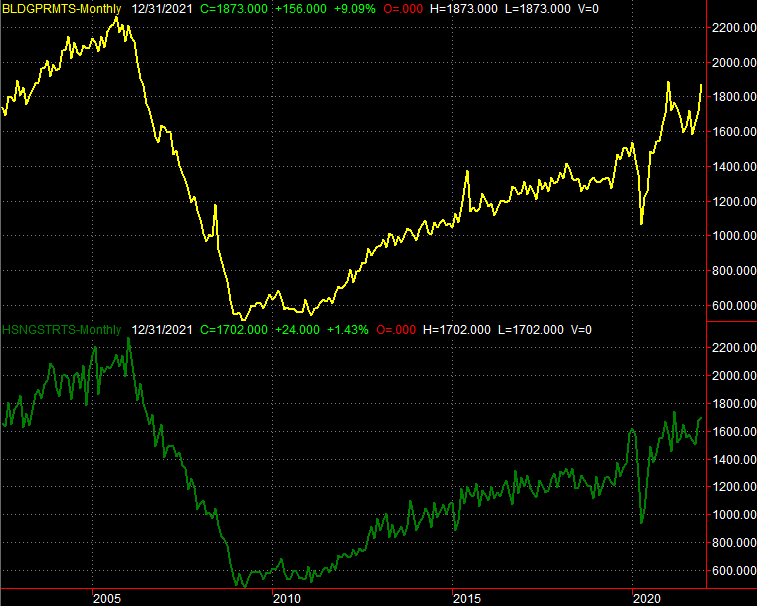
Source: Census Bureau, TradeStation
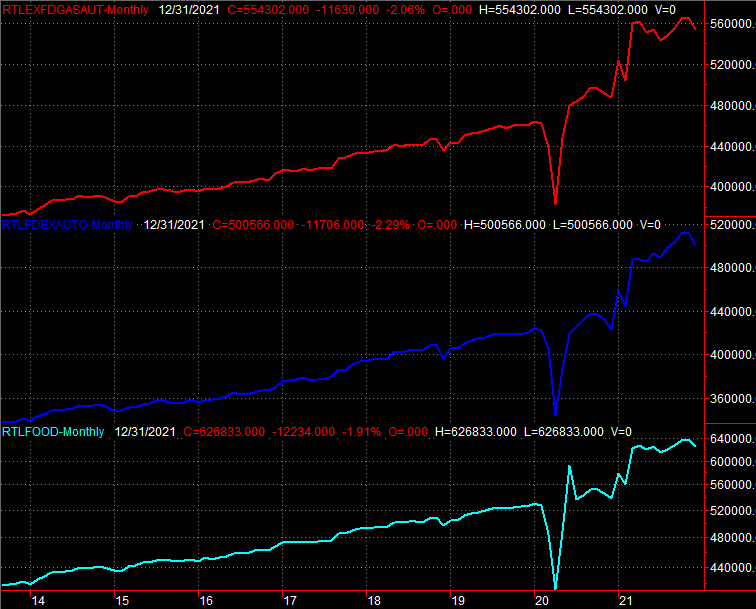
Finally, last month's existing homes sales data will be posted on Friday; new home sales won't be released until next week. Forecasters are calling for a slight lull in sales of existing homes, which have been a bit on the weaker side of late. Then again, the housing market is more than a little pushed and pulled right now.
New and Existing Home Sales Charts
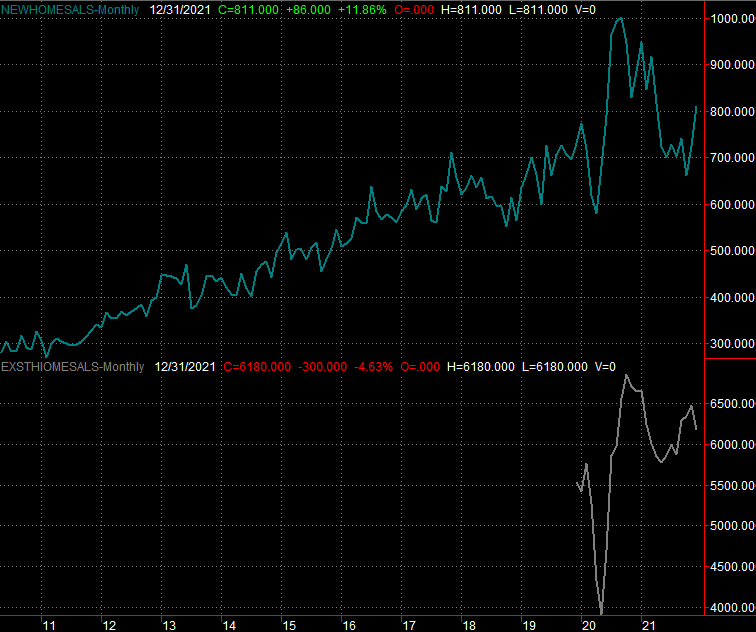
Source: Census Bureau, National Board of Realtors, TradeStation
Stock Market Index Analysis
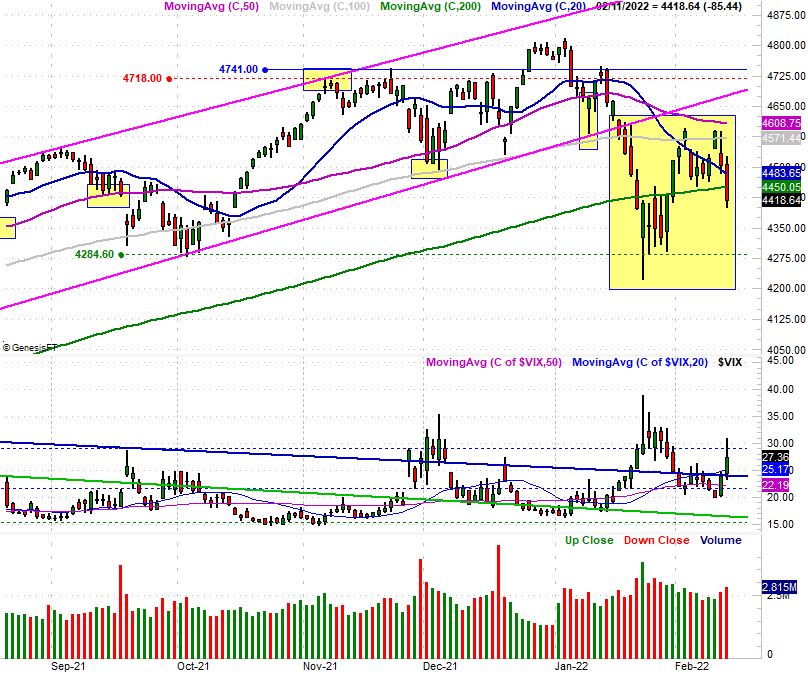
We kick things off this week with a detailed look at the weekly chart of the S&P 500. This view doesn't give us all the details we'd normally be interested in, but the most important idea to embrace right now is the back-to-back failure of the index to punch through a key technical ceiling.
Take a look. Though the S&P 500 still managed to log a gain two weeks back, that week's bullish close was still well below the high for that week. Last week's close was not only well below the high as well, but under the prior week's low too. Traders made two back-to-back weekly attempts to push above the 100-day moving average line (gray), and failed both times. The second failure resulted in a close back under the 200-day moving average line (green). Although the index hasn't yet made a low under the low of 4223 hit three weeks ago, that prospect just got a lot more likely. If that happens, that may well be what prompts people to throw in the towel, so to speak, and really force a correction.
S&P 500 Weekly Chart, with VIX and Volume
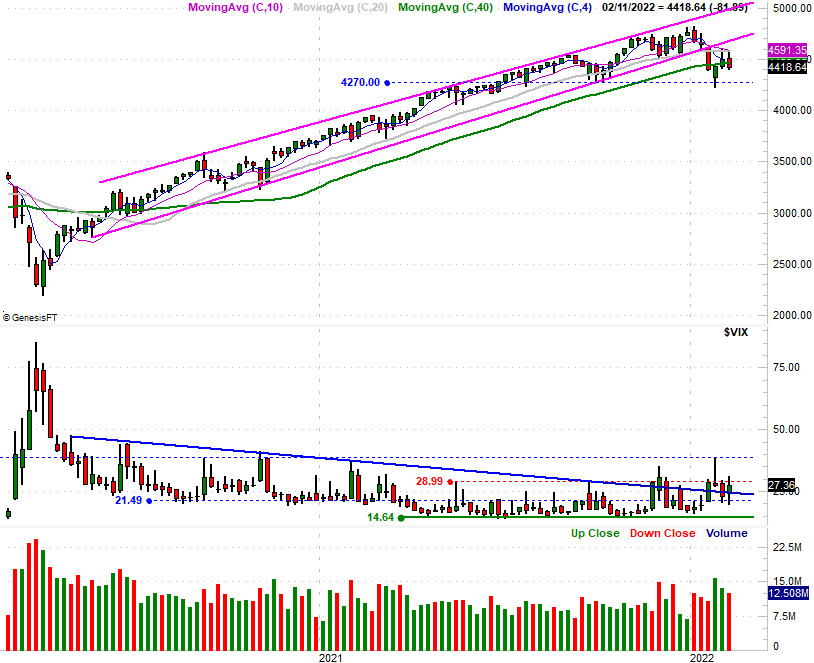
Source: TradeNavigator
Also notice the Volatility Index, or VIX, in the middle of the chart. While it's not charging higher, it continues to peck away at its ceiling near 29. And, it's getting comfortable above the falling resistance line (solid blue) that had been guiding it lower since the middle of 2020. This is a subtle sign that traders' psyches are shifting... in a bearish direction.
Here's the daily chart of the S&P 500. As is made clear, a respectable bullish effort from the first half of the week more than imploded on Thursday and Friday. Perhaps it was the thicket of resistance between 4500 and 4600 that up-ended the effort, or perhaps it was the shocking inflation report; most likely it was a combination of both. Either way, the daily chart shows us that while the bullish volume was waning all the way through Wednesday's peak, the sellers came out of the woodwork on Thursday and Friday.
S&P 500 Daily Chart, with VIX and Volume
Source: TradeNavigator
To see this volume surge on the market's two big losing days suggests there's not a lot of bullish conviction, yet plenty of bearish conviction.
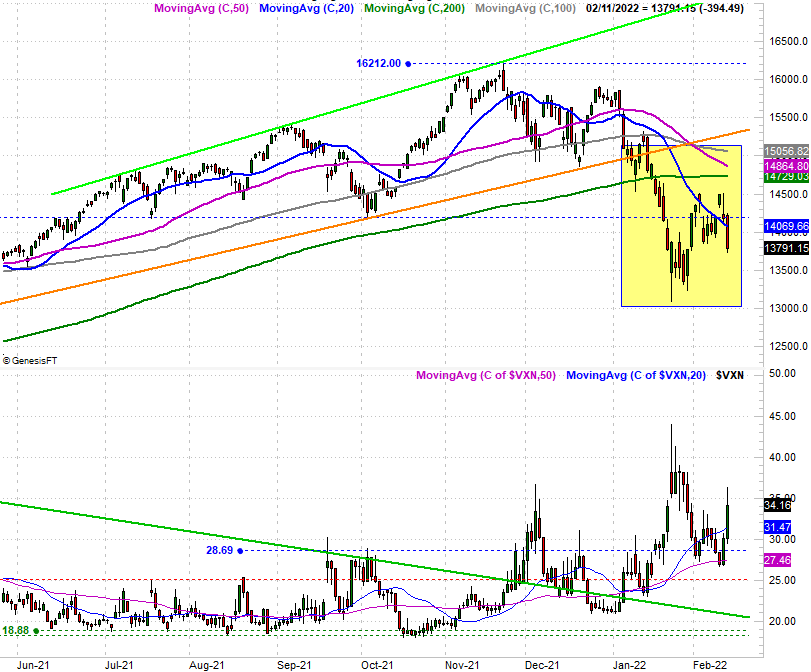
The NASDAQ Composite's chart looks similar, though not identical. The chief difference between it and the S&P 500 is, the NASDAQ is already well below its 200-day moving average line (green). Friday's tumble dragged it back under the 20-day moving average line (blue) at 14,070 though... which is also well under the 200-day line. Also notice the NASDAQ Composite's volatility index, or VXN, is having no problem continuing its march higher. Traders are increasingly hedging against a broad pullback, which means they may unconsciously planning on making one happen.
NASDAQ Composite Daily Chart, with VXN
Source: TradeNavigator
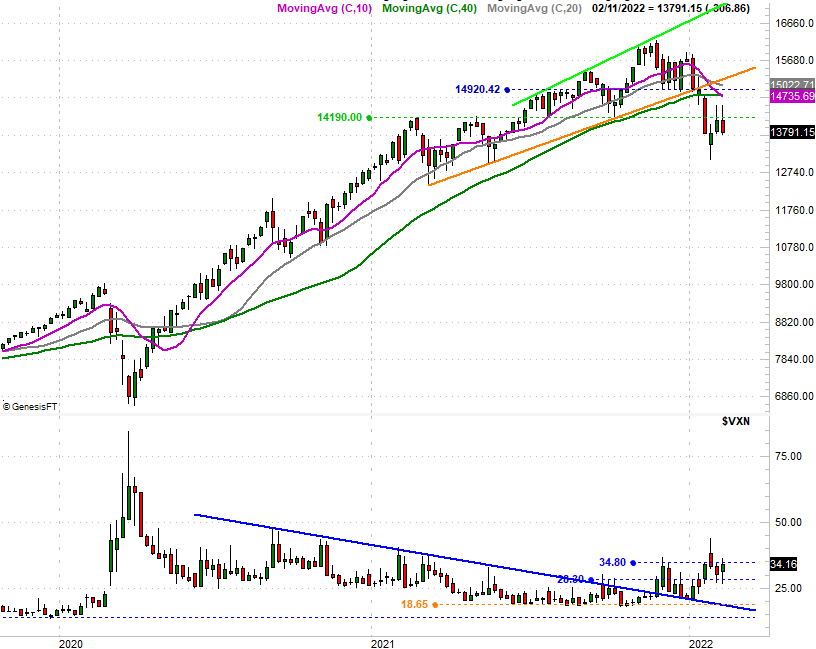
Here's the weekly chart of the composite for a little more perspective... not that you need it. Do note, though, that the shape of the bars for the past two weeks looks identical to the S&P 500's. That is, in both instances the index pulled well back from the weekly peak by the time Friday's closing bell rang, and last Friday's close was near the absolute low for the two-week stretch. The bears are testing the waters of lower lows.
NASDAQ Composite Weekly Chart, with VXN
Source: TradeNavigator
The market is on the defensive; the bulls have something they have to prove here, and soon. All the indices are on the wrong side of all their moving average lines.
On the other hand, assume nothing. Investor's moods are stopping and changing on a dime. Reversals have subsequently been the norm for a while here, and there's nothing to prevent that from happening again now.
In other words -- and as has been the case for some time now -- this all remains a day-to-day affair, and you have to plan for any prospective outcome.