Weekly Market Outlook - The Bulls Charge, But Are Playing With Fire
 The S&P 500 managed to gain a solid 2.0% last week, following through on the bullish reversal made a week prior. But, as far as gains go, it was far from an ideal one. Not only was a gap left behind with Monday's strong open (gaps tend to get filled in), the buying volume deteriorated all the way up. There are fewer and fewer buyers the higher the market goes.
Maybe it won't matter... much. Maybe a slight stumble and renewal of the rally will let more traders board the train if they missed it the first time around. Or, maybe even the slightest of setbacks could turn into a more serious one for a now-overbought market.
We'll weigh both possibilities below, as always, after reviewing last week's economic news and previewing this week's. This past Friday's jobs report was most definitely worth a closer look... and may not have been as impressive as the headline numbers suggested.
Economic Data Analysis
The week was chock-full, starting with Monday's retail sales report for February.... not March. Once again, and against expectations, consumer spending fell. Taking auto sales out of the equation, retail sales fell 0.4% versus expectations of a 0.3% increase.
Retail Sales Growth Charts
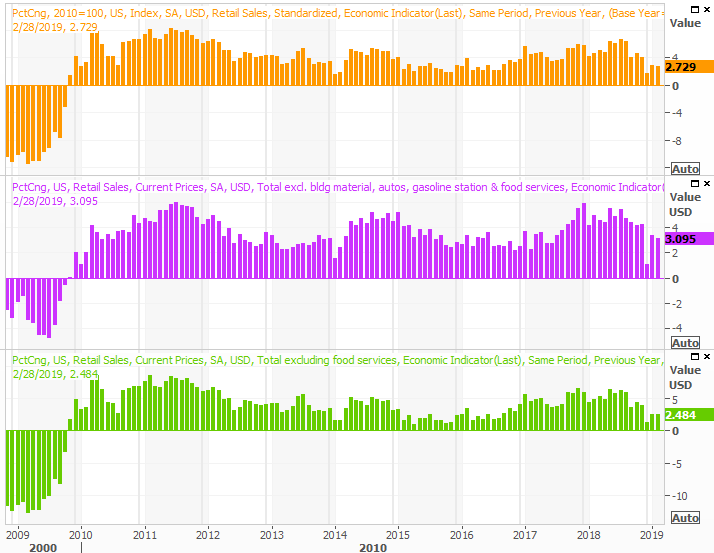
Source: Thomson Reuters
To be clear, the year-over-year figure of retail sales still shows growth - just at a slowing pace. The decline is in the adjusted month-to-month figure. There's also a possibility that, like January's shocking setback, the data read could have been misleading (although no adjustment to that previous read has been offered yet). Even so, the spending data doesn't jibe with employment data and sentiment data. It's also not March's data, and March's figures could easily put retail spending back on track.
In short, take the February retail spending report with a grain of salt.
It was also a key week for ISM data, with both the services and the manufacturing reports being posted. The ISM services index fell from 59.7 to 56.1, while the ISM manufacturing index inched up from 54.2 to 55.3 for March. Curiously (and more on this below), the U.S. economy lost manufacturing jobs last month. It will be interesting to see how much, or even if, the disparity matters.
ISM Index Charts
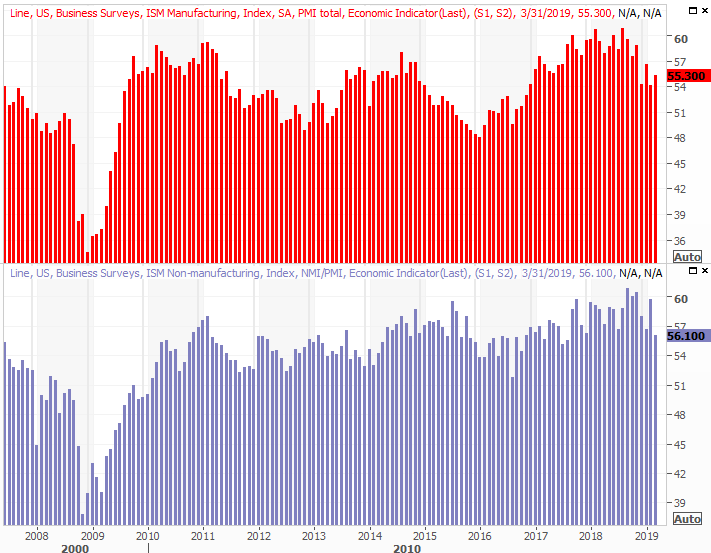
Source: Thomson Reuters
Notice both ISM levels are generally trending lower.
We also heard about March's auto sales last week. Not bad. Not bad at all. Car sales perked up, and truck sales jumped to a record-breaking annual pace of 12.392 million. Although the graphic below doesn't show it (on the orange portion of the chart), the combined annualized rate perked back up to 17.45 million. That's back to the stabilized levels seen near the end of last year.
Auto Sales Charts
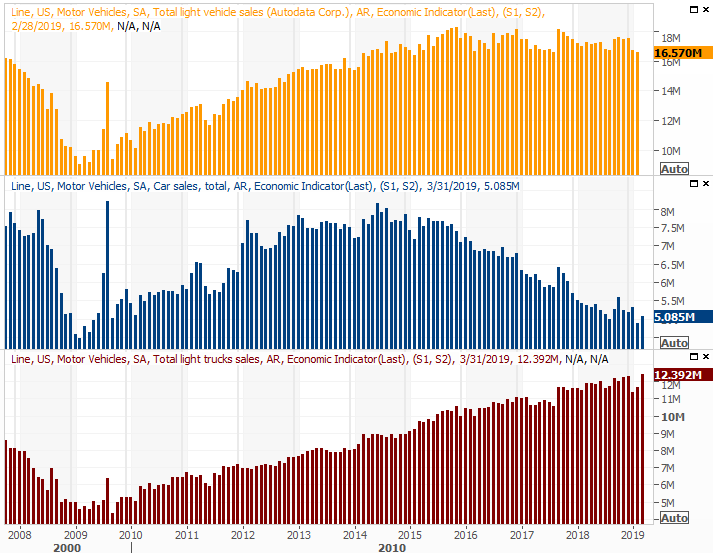
Source: Thomson Reuters
Last week's big Kahana, of course, was March's jobs report. The knee-jerk reaction to the most watched numbers were well received, and understandably so. But, digging beyond the headlines reveals matters aren't ideal. The number of employed people fell, and the number of unemployed people grew. The labor force participation rate as well as the proportion of the population actually both fell. Those figures are detailed at the website here: https://www.bigtrends.com/education/markets/march-jobs-report-wasnt-quite-a-solid-as-suggested
Even so, nonfarm payrolls grew by 196,000, trouncing February's lull, and the unemployment rate held steady at a multi-year low of 3.8%.
Unemployment Rate and Payroll Growth Charts
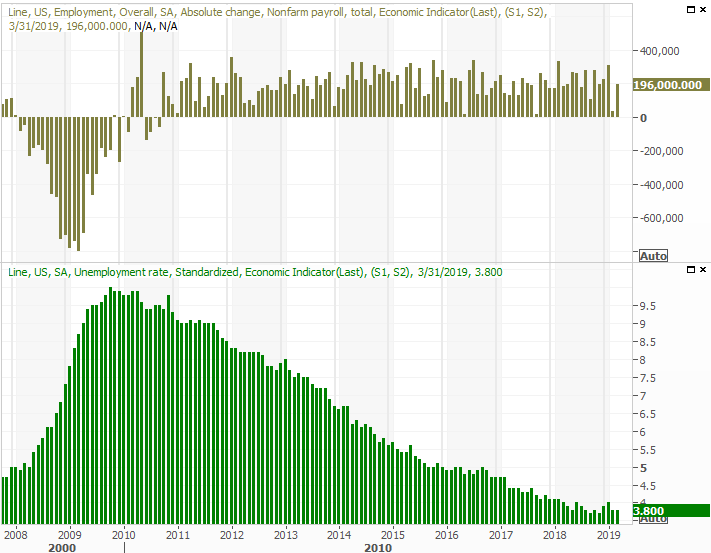
Source: Thomson Reuters
Everything else is on the grid.
Economic Calendar

Source: Briefing.com
This week won't be as busy. In fact, there's only one batch of data we have any real interest in. That's a look at last month's inflation picture, for producers as well as consumers. Economists are looking for stronger price increases this time around than seen in February, although inflationary pressures remain relatively tame.
Producer and Consumer Inflation Charts
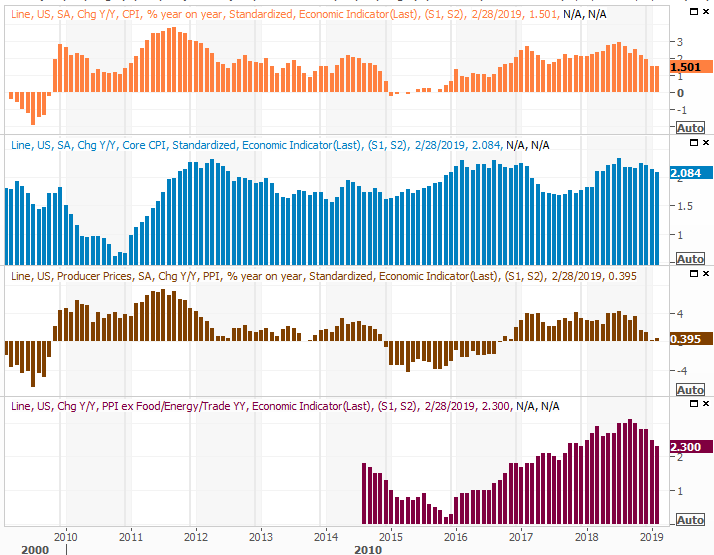
Source: Thomson Reuters
Stock Market Index Analysis
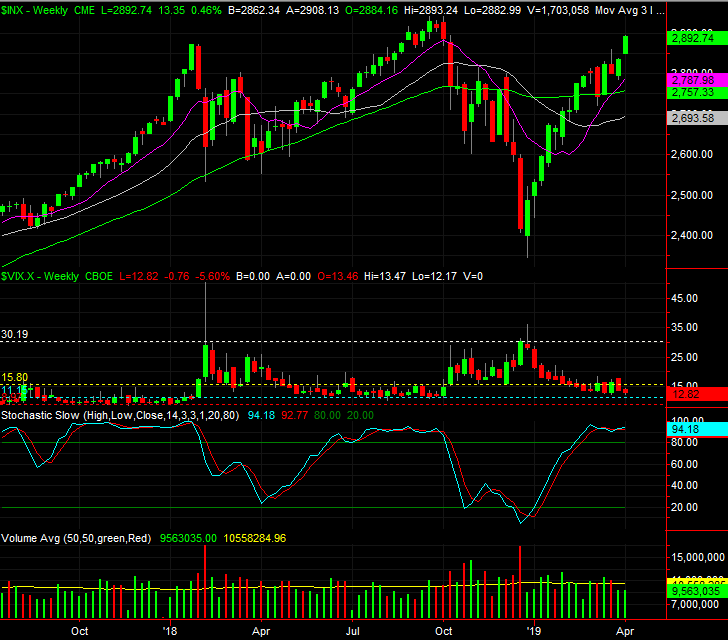
We'll once again start with a look at the weekly chart of the S&P 500, just to set the stage.
As was noted already, last week's 2.0% gain was a nice follow-through on the previous week's rebound effort. But, stocks are already back to an overbought condition.... stochastically. Even just visually though, there's something unrealistic about the rally effort. The S&P 500 is now up more than 23% from its late-December low. It's also now 7.4% above its gray 100-day moving average line, which is about as much divergence as it's historically been capable of mustering.
S&P 500 Weekly Chart, with Volume
Source: TradeStation
There are two other red flags waving on the weekly chart of the S&P 500, however. Once of them is the VIX, and the fact that it appears to be toying with an established support level. [More on that with the look at the daily chart.] The other noteworthy concern is the fact that the volume behind the past two weeks of gains has been particularly light. This isn't necessarily a majority opinion.
Zooming into the daily chart we can get a better sense of some of the things we see on the weekly chart. Namely, on the daily chart it's clear the VIX is finding some support around 12.5 (blue), and that it's within striking distance of a more absolute line in the sand around 12.0 (red). It's also on the daily chart we can tell that not only has volume been weak of late, it faded almost every time the S&P 500 made progress last week.
S&P 500 Daily Chart, with Volume
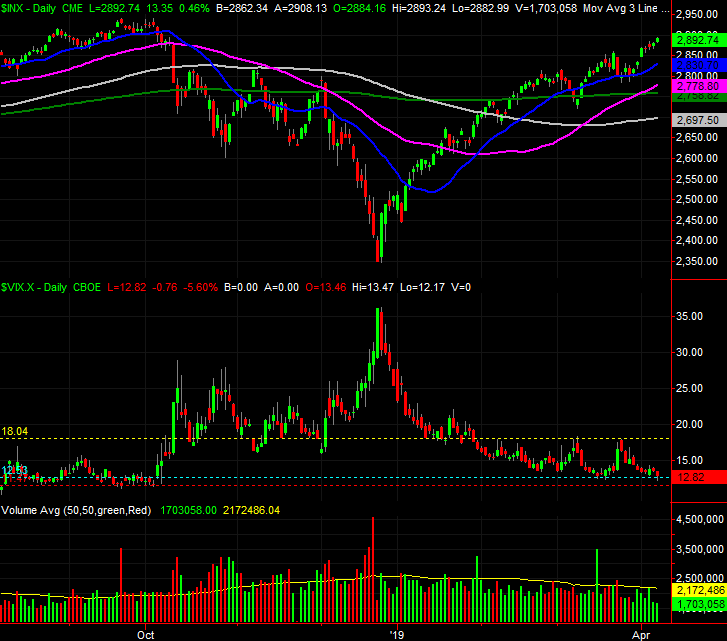
Source: TradeStation
NASDAQ Composite? Same basic story.
NASDAQ Composite Daily Chart, with Volume
Source: TradeStation
The most plausible outcome here, given long-term history, is a modest pullback and the renewal of the bigger-picture uptrend at a more sustainable pace.... enough to shake the VIX and VXN off their lows, and enough let more buyers step in - more volume.
Given short-term history though, no assumption about what this week holds can be made. The prospect of an end to the tariff war with China could easily fan the flames and drive higher highs. We saw stocks become more overextended than they are now in late 2017 and early 2018.
On the flipside, the VIX and VXN are back at oddly low lows, and have a ton of room to rise while the market tanks should the bears find a reason (and that's the key... finding the right reason) to up-end this rally effort. That's a tall order though, just because any and all of the key moving average lines could and would act as support.
This remains a day-to-day affair. Rule nothing out, and bear in mind that headlines are still in charge when there are no technicals exerting their influence.
Either way, September's high of 2939 is a key psychological ceiling, and the 200-day line (green) currently at 2759 is the most important floor right now. Keep an eye on the VIX too.