Weekly Market Outlook – That’s What Happens When You Play With Fire
The recovery effort that took shape early last week was already struggling headed into Friday's action, unable to push above the 50-day moving average line. But, when the rug got pulled out of from underneath that effort on Friday, it did so in spades. The 3.0% tumble the S&P 500 took on Friday translated into a 1.1% setback for the week. The close at 2847 was the lowest weekly close since late May.
Though the renewed selloff was scary and a little painful, it's also not done a tremendous amount of damage yet. From its peak, the S&P 500 is still only down 6% from its high. That's not normally enough to constitute a full-blown correction, and this particular pullback is taking shape after an abnormally big runup. Even with the stumble, the index hasn't even tested the pivotal 200-day moving average line.
We'll take a detailed look below, as always, after reviewing last week's economic announcements and previewing this week's.
Economic Data Analysis
It was easy to overlook, given all the noise the Federal Reserve and its chiefs were able to make. But, last week, there was a handful of noteworthy economic news.
It was a particularly big week on the real estate front, with existing home sales being reported on Wednesday, followed by new home sales on Friday. The results were... mixed, and mostly uninteresting. Sales of existing homes rolled in at a pace of 5.42 million, slightly more than forecasted and measurably more than the June figure of 5.29 million. New home sales hit an annualized rate of 635,000 in July, down from June's strong clip of 728,000, and short of the 645,000 economists were expecting.
New, Existing Home Sales Charts

Source: Thomson Reuters
Still, it's arguable that home-buying is growing again, even if erratically.
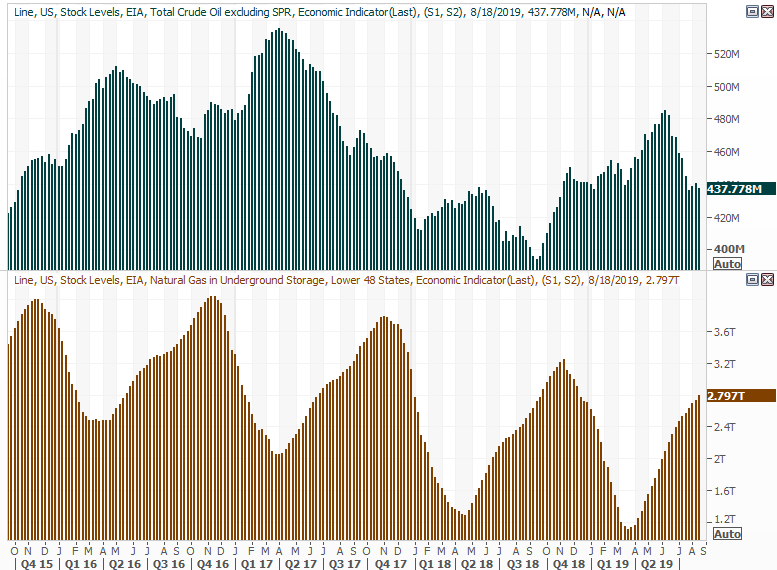
The only other item of interest last week wasn't something we previewed a week ago, but merits a closer look all the same. That's the amount of crude oil the U.S. has stockpiled, and to a less meaningful degree, the amount of natural gas now in storage. Crude inventories fell by 2.7 million barrels after the prior week's 1.6 million. Several weeks ago, inventory levels were on the rise again, suggesting the industry hadn't remembered the lessons of overproduction taught in 2015. That risk subsided quickly and decisively though.
Crude Oil, Natural Gas Stockpile Charts
Source: Thomson Reuters
The stockpile figure is an important one to monitor here, but also a tricky one to figure out. Trade tensions along with geopolitical tensions -- on top of the fact that the U.S. is now a net exporter -- only makes any analysis more confusing. Regardless, as it stands right now, crude inventories are in check, and falling. That's fruitful for oil prices, presuming an economic headwind doesn't crimp demand. It likely won't.
Economic Calendar
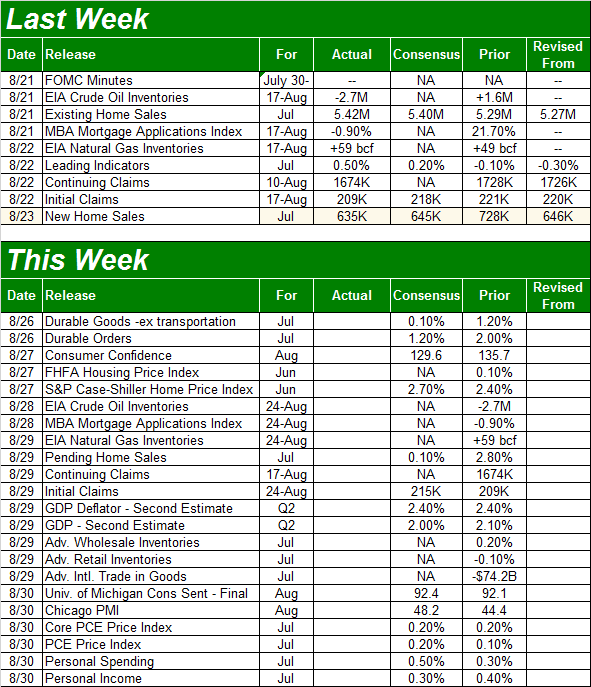
Source: Briefing.com
This week is going to be a little busier, though not everything on the calendar for this week is all that important.
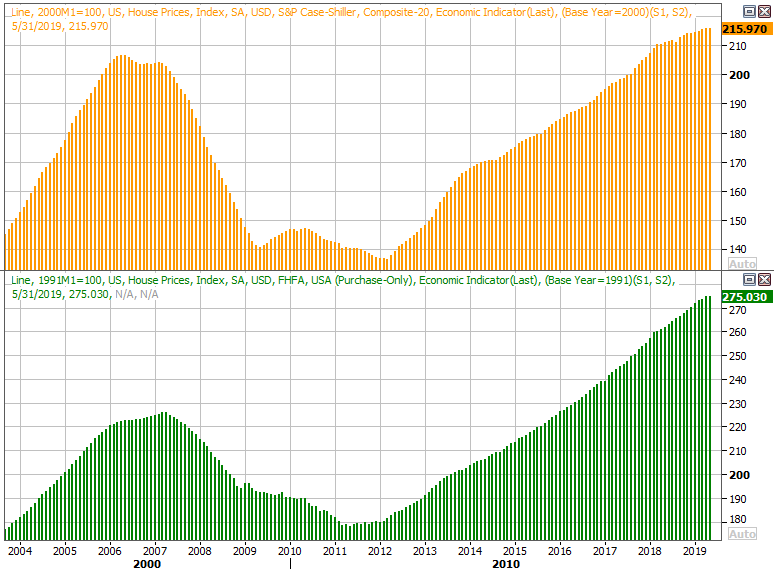
One item that is important is Tuesday's double-dose of real estate pricing news. Though the numbers are only through June, both the FHFA Housing Price Index and the S&P Case-Shiller Index will be revealed then. Each continues to rise, but each rise is clearly slowing. The pros don't think the pace has changed either. But, if somehow lower interest rates (even before July's rate cut) have inspired new home-buying demand that pushes prices higher, that could be market-moving.
Home Price Charts
Source: Thomson Reuters
Thing is, given the other real estate data through June, an acceleration of prices isn't likely.
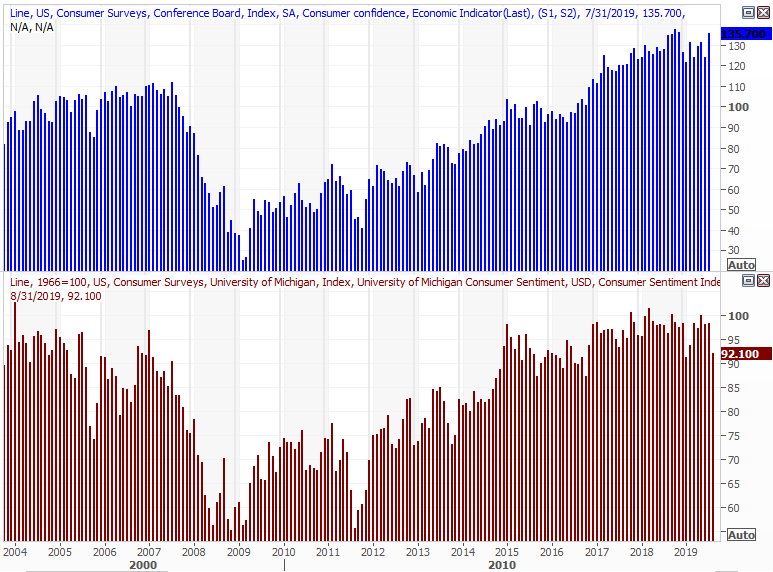
Also this week we'll get a major look at how consumers, and investors, are feeling. The Conference Board's consumer confidence reading is due on Tuesday, to be followed by the third and final reading of the Michigan Sentiment Index on Friday. Both are expected to come in lower, extending what's become a long-standing stretch of sideways movement.
Consumer Sentiment Charts
Source: Thomson Reuters
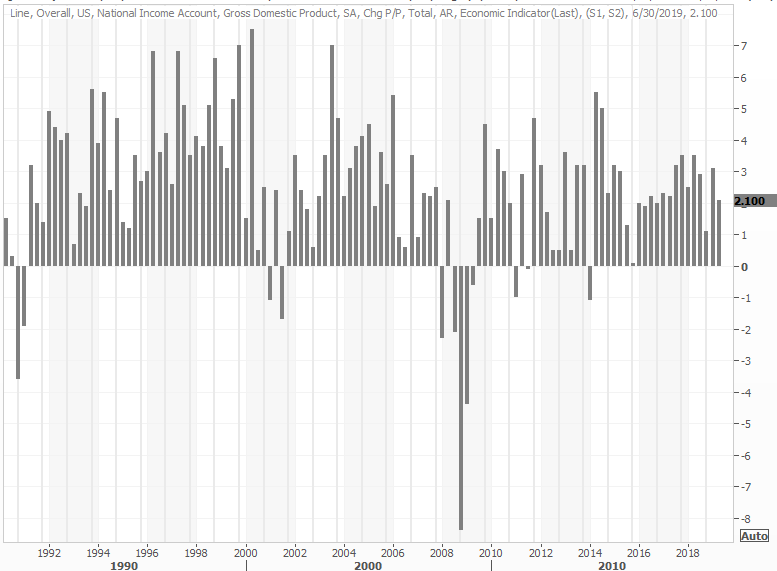
In between, on Thursday, look for the second (of three) readings on Q2's GDP growth. Economists are looking for a slight contraction from the first estimate of 2.1%, to 2.0%. That's still healthy, though at this point not entirely relevant. Much has changed since the end of the second quarter.
GDP Growth Charts
Source: Thomson Reuters
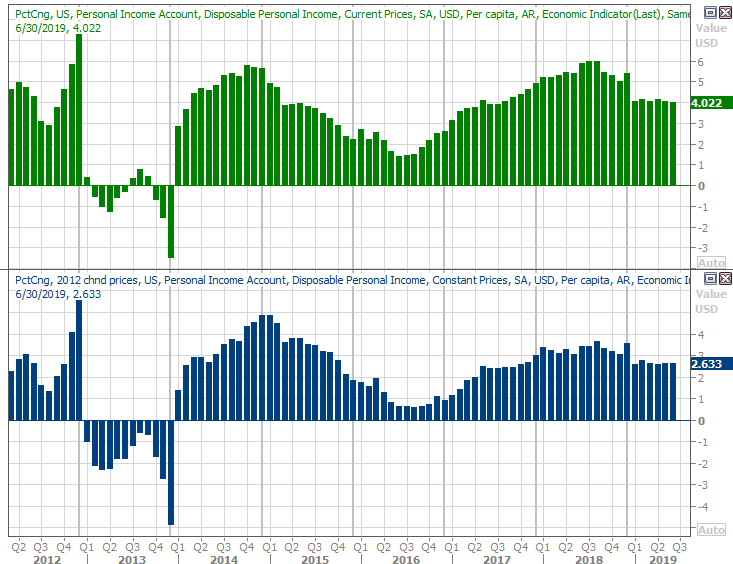
Finally, we're going to add a couple of related data points to our list of ongoing analysis that we hadn't covered in the past. Going forward we'll be monitoring personal income and personal spending, which are reported as having a 'high impact' on the market's direction. The next report will be posted on Friday. Economists are expecting solid forward progress on both fronts. But, year-over-year, that doesn't mean much.
Personal Income, Personal Spending Growth Charts
Source: Thomson Reuters
Stock Market Index Analysis
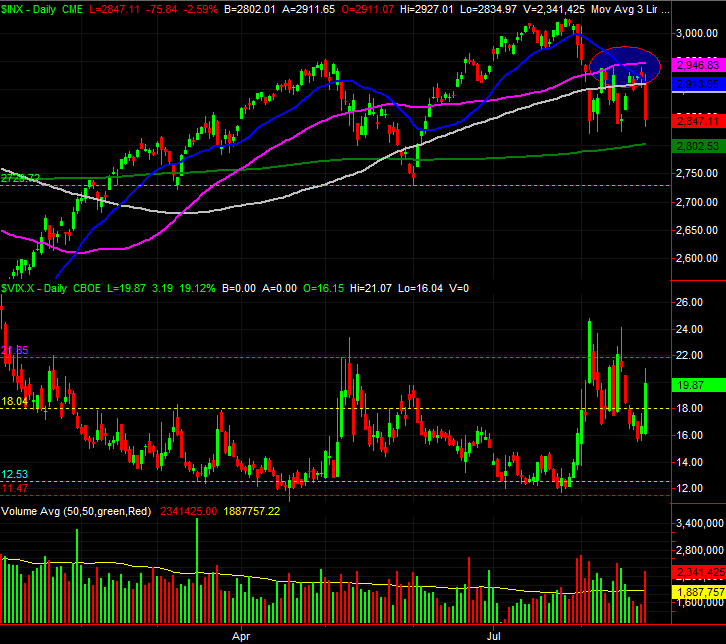
Good news, and bad. The bad news is, the 50-day moving average line (plotted in purple on the daily chart of the S&P 500 below) served as a resistance line last week, helping to prompt Friday's meltdown. The good news is, the green 200-day moving average line has yet to even be tested as a floor. More good news ... the VIX is nearing a more absolute ceiling near 30, which tends to be reached when the index is making a major bottom. Ideally, the VIX will hit 30 and the S&P 500 will find support at its 200-day moving average line at the same time, and mark a pivot back into a bullish mode.
S&P 500 Daily Chart, with VIX, Volume
Source: TradeStation
That's the best outcome investors can hope for here anyway. Whether or not things will work out that way remains to be seen.
Working against that best-case-scenario outcome is the calendar, in more ways than one.
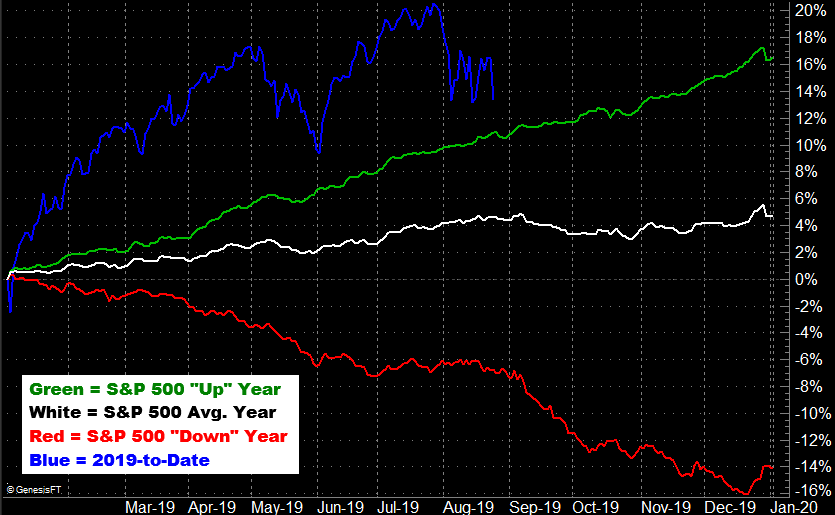
The images below have been discusses before, but merit refreshed look. They're a comparison of where the S&P 500 currently is versus where it normally would be at this time of year, and where the index would usually be at this point in the third year of a Presidential term. Annually, this month and next are generally weak times for the market. Following the four-year Presidential term schedule, stocks should be weak through November.
S&P 500 Performance vs. Average Year
Source: TradeNavigator
S&P 500 Performance vs. Average Presidential Term
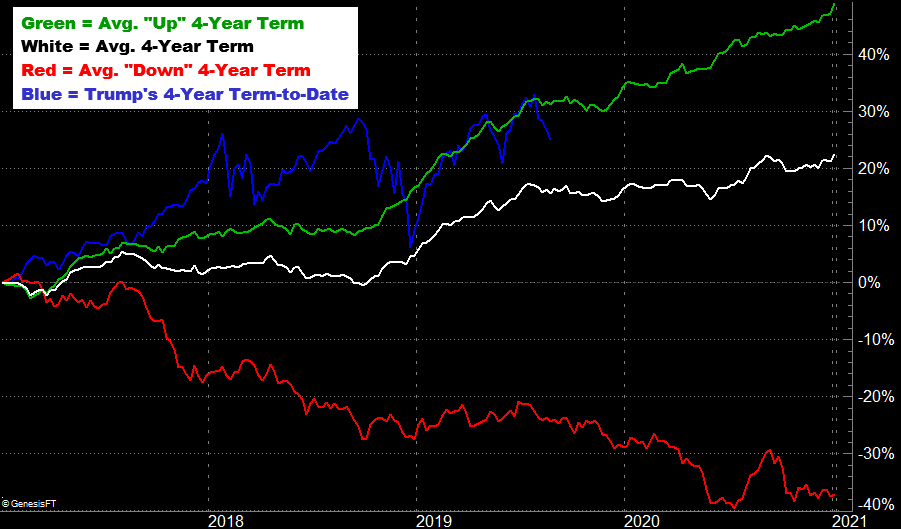
Source: TradeNavigator
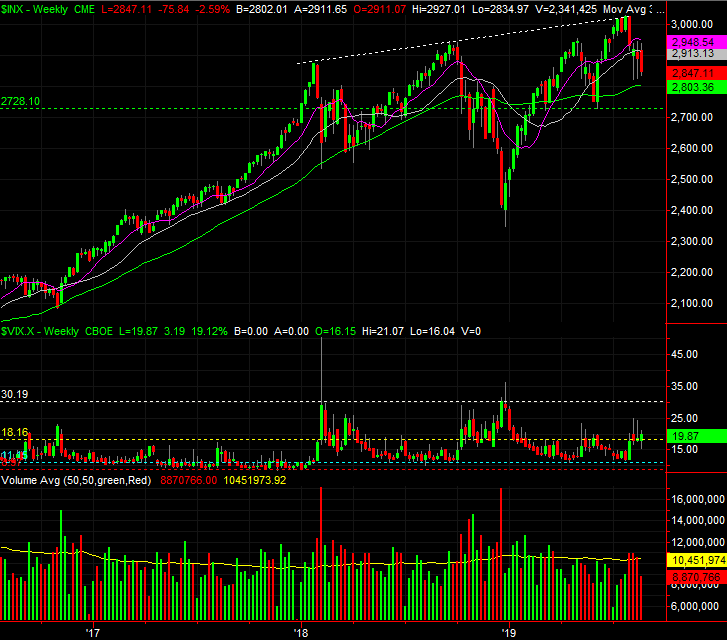
With that as the backdrop, zooming out to the bigger-picture weekly chart suddenly makes a lot more sense. Though the recent selloff has felt ugly, the truth is, it's not been that dramatic. The 6% stumble doesn't even yet qualify as a full-blown correction, which tend to be closer to 10% selloffs.
And where might a 10% setback leave the S&P 500? Somewhere around 2721, where a green line is plotted on both the daily and the weekly stock charts. That's essentially where the index made key lows in March and then again in June.
S&P 500 Weekly Chart, with VIX, Volume
Source: TradeStation
In some ways that prospective floor is a healthier, better one than the 200-day moving average line at 2802. A move to the lower boundary would give the market more time to work through the likely calendar-based weakness, and it would also give the VIX more time to make its way to 30 - or perhaps even higher - where it usually has to reach to mark a major, trade-worthy bottom.
Or, perhaps a move to 2721 still isn't enough to turn into a full-blown capitulation.
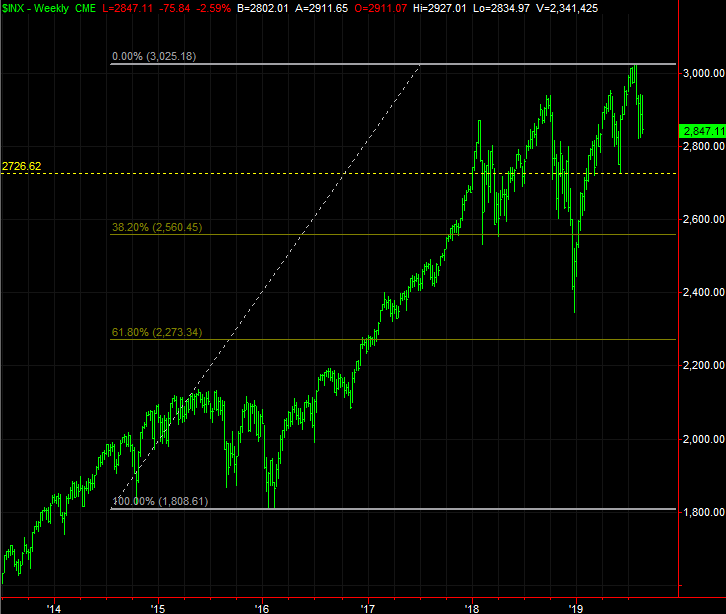
It's more of an acknowledgment of a possibility than a prediction, but the next most noteworthy Fibonacci retracement line in play is the 38.2% retracement of the span between 2016's low and 2019's peak, at 2580. Curiously, that level was an important support level in early 2018 (though that meant nothing in December of last year, when the index plunged to 2347.
S&P 500 Weekly Chart, with Fibonacci Retracement Lines
Source: TradeStation
Or, maybe there's no more downside at all. This market, if nothing else, has been very capable of doing the unexpected.
On balance though, the most fruitful viewpoint is one that the market now needs to prove its worth, rather than the other way around. That makes the most important task now figuring out where the ultimate floor will be found. We've lead out three plausible ones, although 'when' is going to be just as tricky to identify as 'where.' The turn could be pushed back as far as November, if there's a turn to be made.