Weekly Market Outlook - THAT Was (Probably) the Knockout Punch
 For a short while last week, it looked like the market might sidestep a correction and rekindle the uptrend that was so impressive through the first four months of the year. But, no dice. Spurred by word that a new round of tariffs would be placed on imports from Mexico, the already-fragile market broke below a key line in the sand.
The bulls might get a chance to stop the bleeding and rekindle the uptrend. But, given the time of year and sheer scope of the recent rally, Friday's setback could be interpreted as the proverbial last straw. Stocks may have to go through a big dip before it can start to climb again.
Finding the pivot, of course, is the key.
We'll take a detailed look at things below, after a review of last week's economic news and previewing this week's economic announcements.
Economic Data Analysis
A week ago we mentioned that March's home pricing data could bolster a fading housing market. That's didn't happen. Though prices continue to rise, they're rising at the slowest pace we've seen in years. The Case-Shiller Index only improved 2.7% year-over-year, while the FHFA Housing Price Index was only up 0.1%. Both fell short of expectations.
FHFA, Case-Shiller Home Price Charts
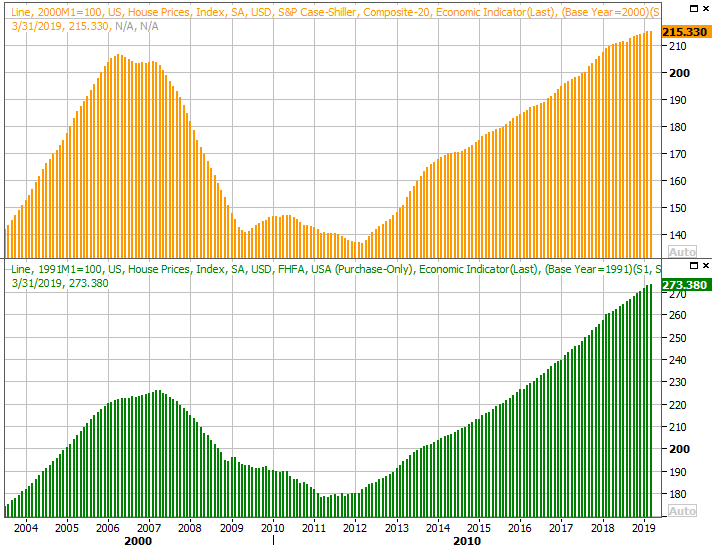
Source: Thomson Reuters
It's not necessarily the end of the world. Home values are well into record-level territory, and sales volumes are... ok. Still, each slower step forward is one step closer to backward.
The flipside: Even though many of their homes aren't gaining in value like they were just a year ago (and despite plenty of dire headlines), consumers like what they see, and like how they feel. The Conference Board's consumer confidence score jumped to 134.1 last month, while the Michigan Sentiment Survey's reading of 100.0 puts that measure within reach of multi-year record highs.
Consumer Sentiment, Confidence Charts
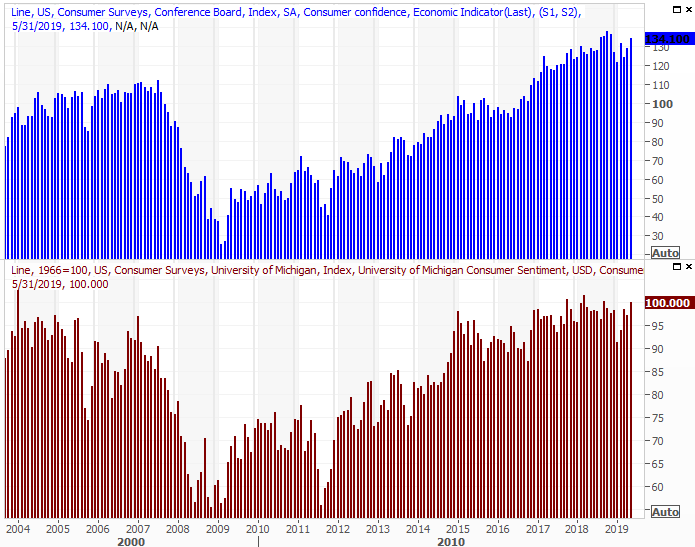
Source: Thomson Reuters
Don't take lightly the fact that sentiment remains strong even when it's "not supposed to be." How consumers feel dictates how they spend.
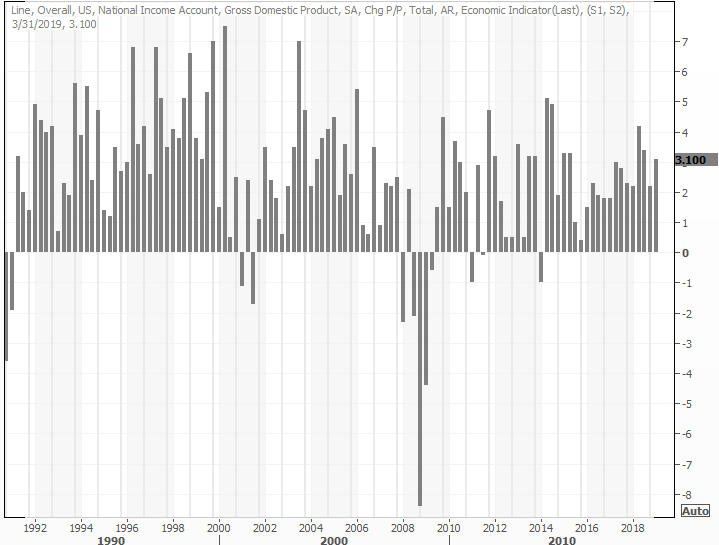
Finally, last week we heard the second (of three) estimates of Q1's GDP growth. It was dialed back from the previous estimate of 3.2%, but not much. Economists think 3.1% is a more accurate figure. That's still impressive, and recession-defying for a quarter that, earnings-wise, wasn't exactly thrilling.
GDP Growth Chart
Source: Thomson Reuters
Everything else is on the grid.
Economic Calendar
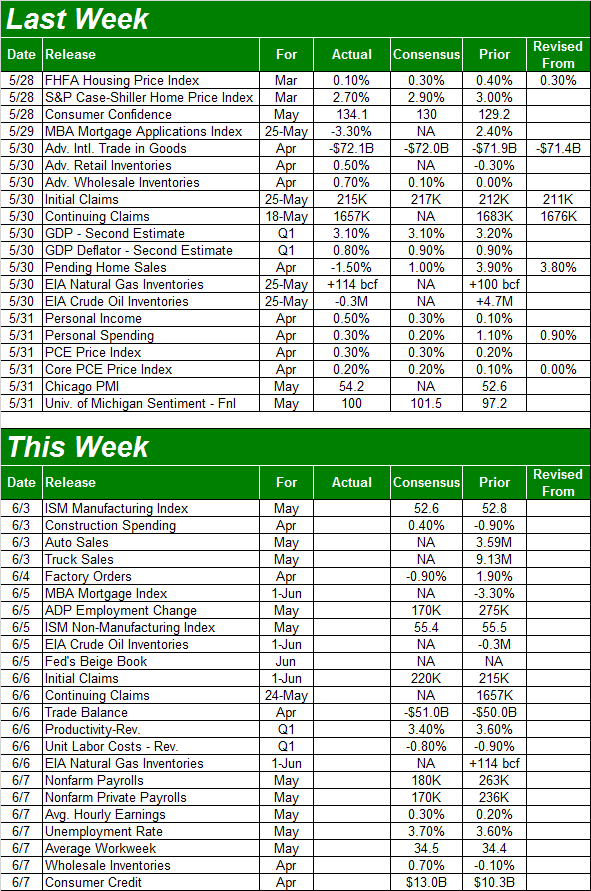
Source: Briefing.com
This week is going to be even busier, ending with the climax of May's jobs report on Friday. But, there's a lot of potentially market-moving stuff in the lineup between here and there.
That party gets started on Monday with last month's ISM Manufacturing Index report, to be followed on Wednesday by the services version of the same. Economists are looking for slight lulls from both, though each remains above that crucial 50 level.
ISM Manufacturing, Services Index Chart
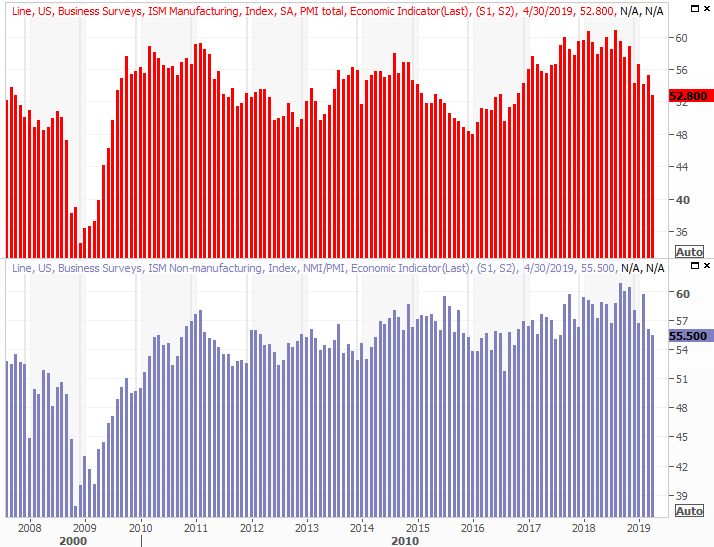
Source: Thomson Reuters
Still, there's no denying both readings are in bigger-picture downtrends.
Also on Monday (though we won't get the fully-tabulated data until after Monday) automakers will be announcing May's sales totals. This has been something of a sore spot for a while, particularly since truck sales leveled off in recent months. We need a win here, but it's not clear this is the month we'll get it.
Automobile Sales Chart
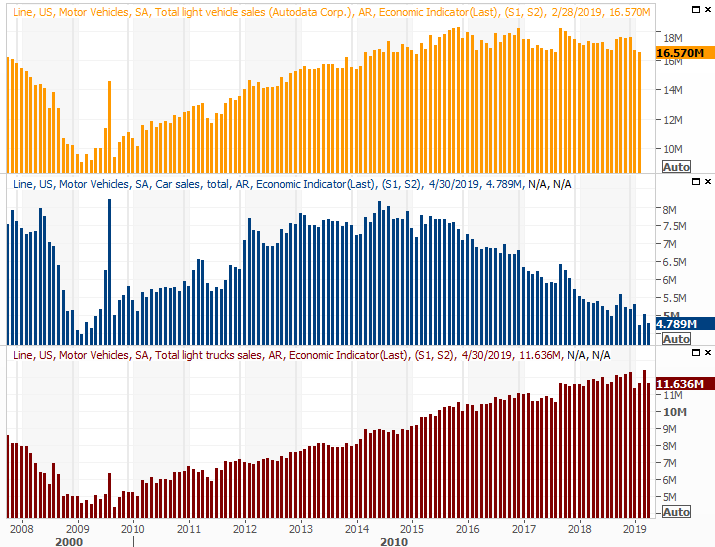
Source: Thomson Reuters
The biggie for this week, of course, is going to be a look at last month's jobs picture.
You'll recall a month ago that the unemployment rate fell to a multi-decade low of 3.6% after the addition of 263,000 new jobs. The pros don't expect such a strong showing this time around, calling for the unemployment rate to rise to 3.7% (still very low) on the heels of 180,000 new jobs (still very good, given capacity).
Payroll Growth, Unemployment Rate Chart
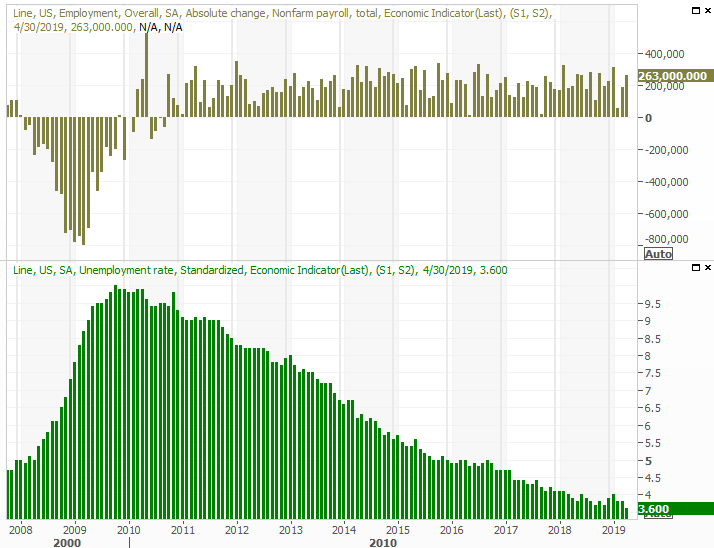
Source: Thomson Reuters
As always, we'll take a deeper look at ALL the jobs and employment data at the site. The superficial numbers touted by the media are only a small piece of the picture.
Stock Market Index Analysis
The most bullish aspect about last week's action? Friday's bearish gap, which might - MIGHT - set the stage for a rebound this week. That is, the effort to fill in the gap may inadvertently start a new bullish move, which might get traction. It seems like investors are willing to entertain bullish possibilities.
On the other hand, that's not the 'best' bullish argument you want to be able to make, particularly after both of the key indices breaks below a pivotal long-term moving average as they did last week.
That makes what happens this week very important, though we should warn you to not over-react to the action right out of the gate. There's (too good of) a chance the first lunge is going to be a fakeout, ultimately leading into a move in the other direction. In other words, early bearishness this week could soon put a big bottom and upside move in place. Conversely, a little bit of bullishness early this week may be a setup for an even bigger move to even lower lows. We're in that sort of distrusting, "please prove me wrong" environment.
Take a look at the daily chart of the S&P 500 below. On Wednesday and Thursday, it looked like the 200-day moving average line (green) was going to hold up as support and fuel a rebound. As of Friday, it clearly didn't.
S&P 500 Daily Chart, with VIX, Volume
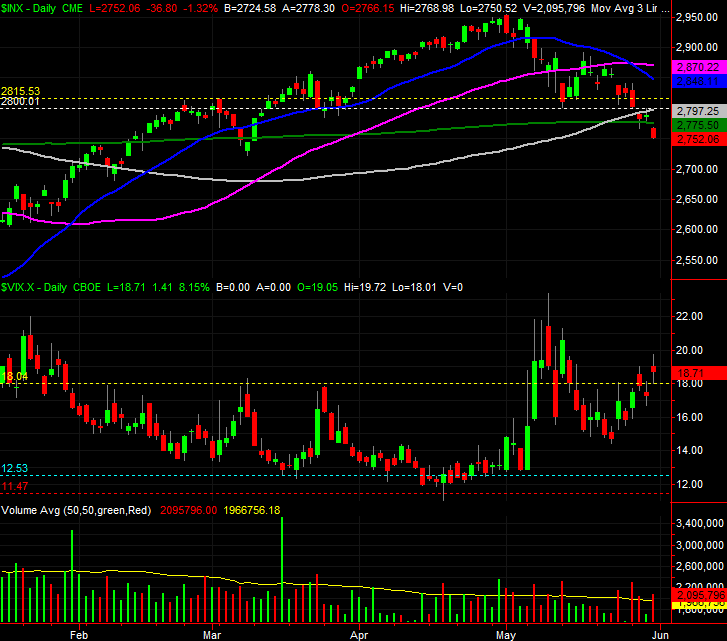
Source: TradeStation
Also note that of the past six trading days, the four most bearish ones were also the highest volume days. The two decent ones were on poor volume.
Zooming out to the daily chart of the S&P 500 puts things in perspective for us. This current setback looks an awful lot like the one from October, though hasn't yet traveled as far. The image also shows the VIX has yet to make its way back to the 30-ish area that usually coincides with a major bottom, but it has punched through a more interim ceiling right around 18.7.
S&P 500 Weekly Chart, with Volume
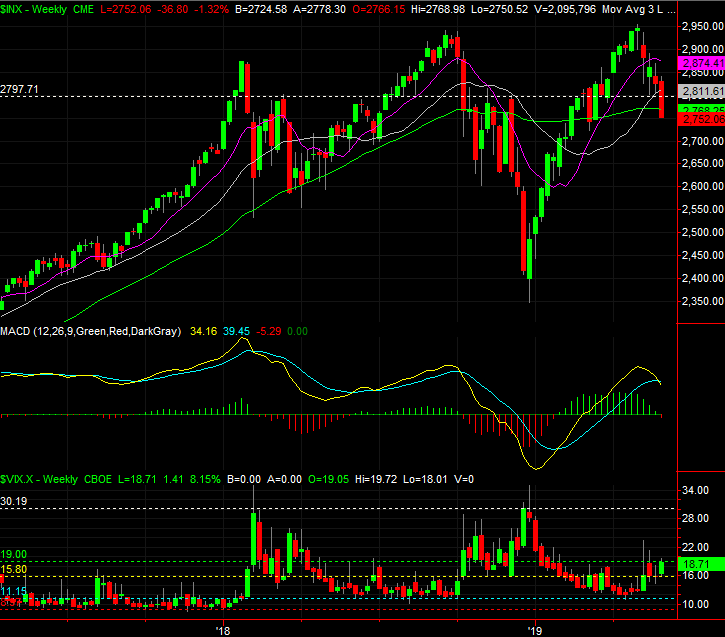
Source: TradeStation
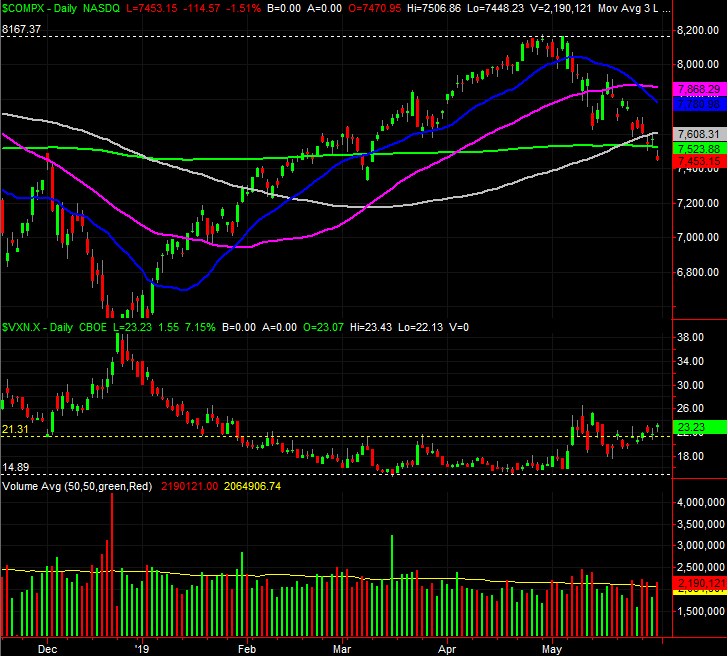
All the same basic themes apply to the NASDAQ Composite. That is, the 200-day line here has been busted as well. Now we're going to see if the bulls completely fold, or are ready to push back...
NASDAQ Composite Daily Chart, with VXN, Volume
Source: TradeStation
... though it might take a couple of days for that dust to fully settle and for both sides to make a decision they can live with.
This is quickly turning into a psychological chess match. Superficially, the break under the 200-day moving average lines is bearish. In this particular case though, the bulls may push back. They'll need to get the S&P 500 back above the 100-day moving average line (gray) to make any rebound fully take hold. If they fail to do that and instead let the S&P 500 slip back under its 200-day moving average line at 2775.5, that may be the move that inspires another more serious wave of selling.
If instead the S&P 500 plummets early this week, that may quickly be interpreted as too much, too fast, leading into a dead-cat bounce. How far such a bounce takes the index will depend, but in all cases, the 100-day moving average lines currently at 2811.6 is the line in the sand.
Whatever and whenever it happens, a VIX surge to near 30 should coincide with a major bottom.