Weekly Market Outlook - Stocks Tiptoe to New Highs, But It's Ugly Progress
Last week marks a second winning week in a row for the market, at a time of year not known for bullishness. Granted, they're ugly wins. A couple of "up" days we saw more bearish volume than bullish, and more losers than winners. Nevertheless, an ugly win is still a win. We have to assume a trend in motion will remain in motion until we have a clear reason to think otherwise.
 The break to new multi-week highs doesn't hurt the bullish argument either.
All the same, we're cautious here. We'll look at why after we run down last week's economic news and preview this week's economic announcements.
Economic Data
There were plenty of economic announcements dished out last week, though not many of them were of significant consequence. Just as well. Earnings season started in earnest last week, so all eyes are on that data anyway.
The biggie was last month's inflation report. There's a lot of it. Consumer prices grew 0.1% month-to-month, which isn't much. But, on an annualized basis, the inflation rate now stands at 2.87%. That's the highest rate since 2012, when things were up against very low comps. To its credit, the Federal Reserve saw the rapid increase coming and did what it could/should to temper it without torpedoing the economy. Only time will tell if they're proceeding at the proper pace.
Consumer and Producer Inflation Charts
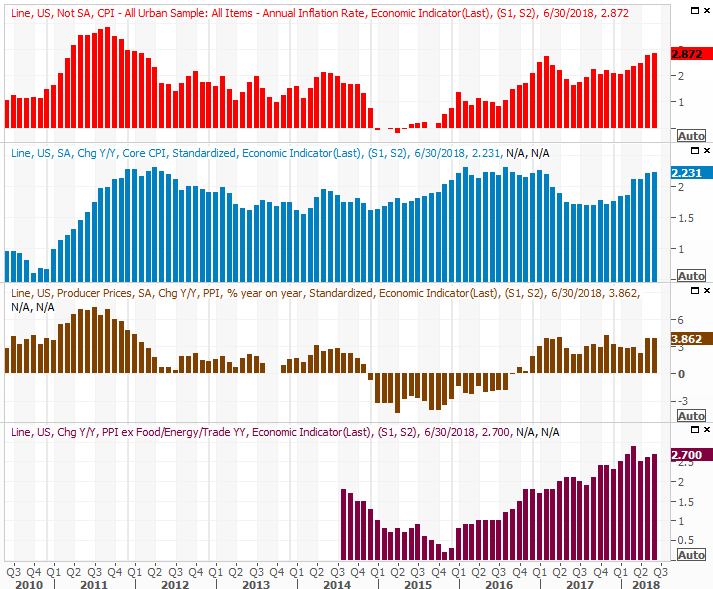
Source: Thomson Reuters
Producer inflation is clearly on the rise too.
The only other noteworthy numbers from last week were the prior week's crude oil and natural gas stockpile levels. Continuing the trend, crude inventory levels fell again, keeping up the bullish pressure on crude oil prices. In fact, crude oil inventory levels are at multi-year lows, further underscoring the idea that the industry is maintaining its production discipline.
Crude Oil and Natural Gas Stockpile Charts
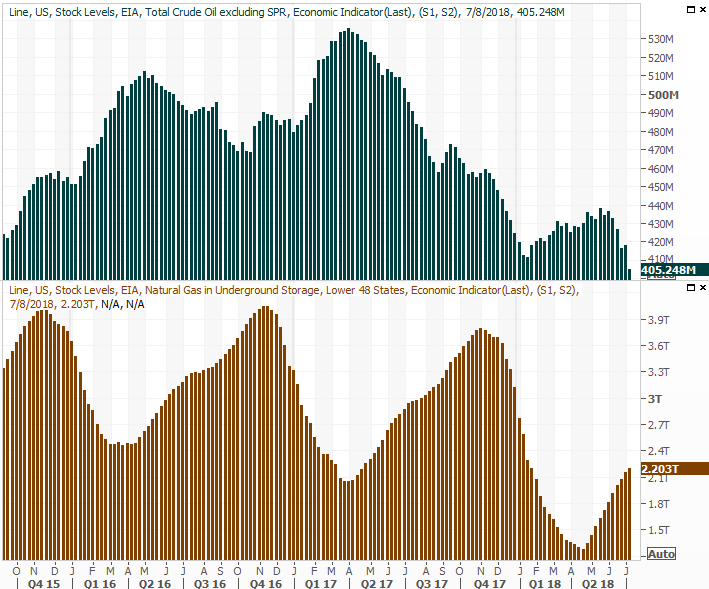
Source: Thomson Reuters
Everything else is on the grid.
Economic Calendar
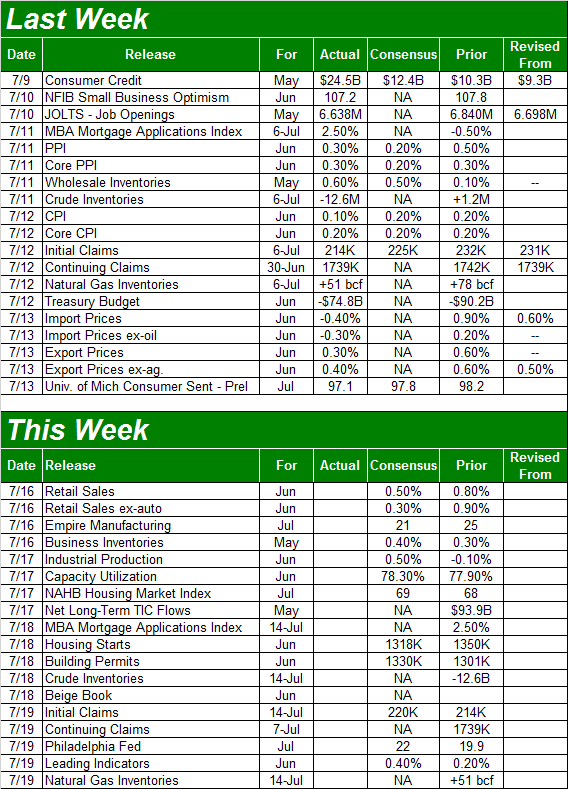
Source: Briefing.com
This week is going to be a little busier, with much of what's in the queue going to be important. That busyness will be exacerbated, of course, by more earnings announcements.
The party starts on Monday, with last month's look at retail sales. May's figures were not only strong, but much better than expected. The pros are calling for another strong month of consumerism, but don't be surprised if things are oddly firm again.
Retail spending had been in a healthy uptrend for some time.
Retail Sales Charts
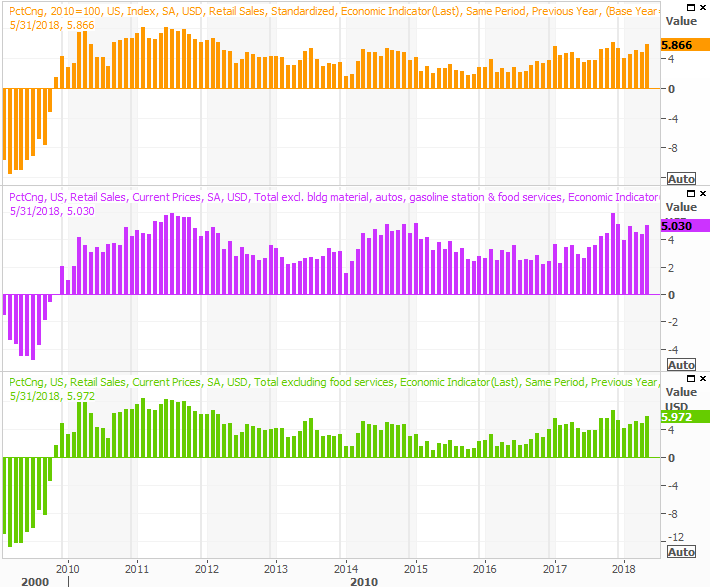
Source: Thomson Reuters
On Tuesday we'll get another biggie... last month's industrial productivity and capacity utilization. Economists are looking for another month of forward progress. That will be an important victory at a critical time. Things slowed just a bit in May, and we don't want that to serve as the beginning of a lull. (And, it probably didn't.)
Industrial Productivity and Capacity Utilization Charts
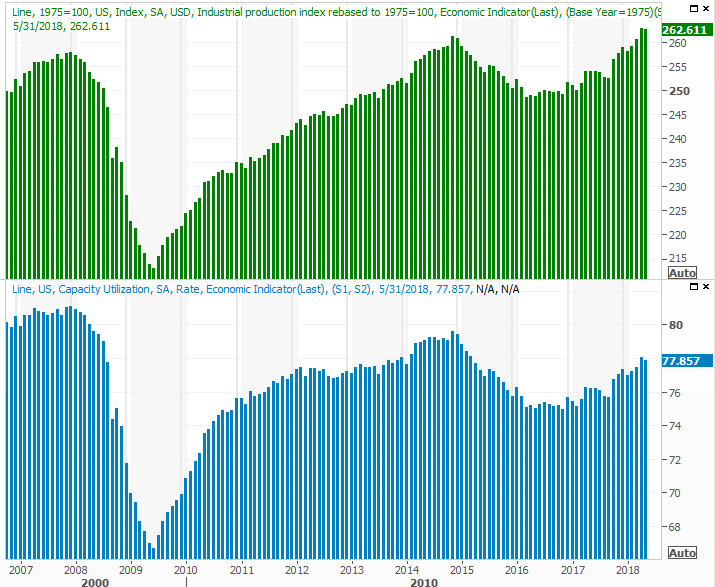
Source: Thomson Reuters
Finally, look for June's housing starts and building permits reports on Thursday. We could use a boost here... not that the trend's been disastrous. It does seem to have been slowing though, leading to a general lack of inventory that may well be holding total home sales back.
Housing Starts and Building Permits Charts
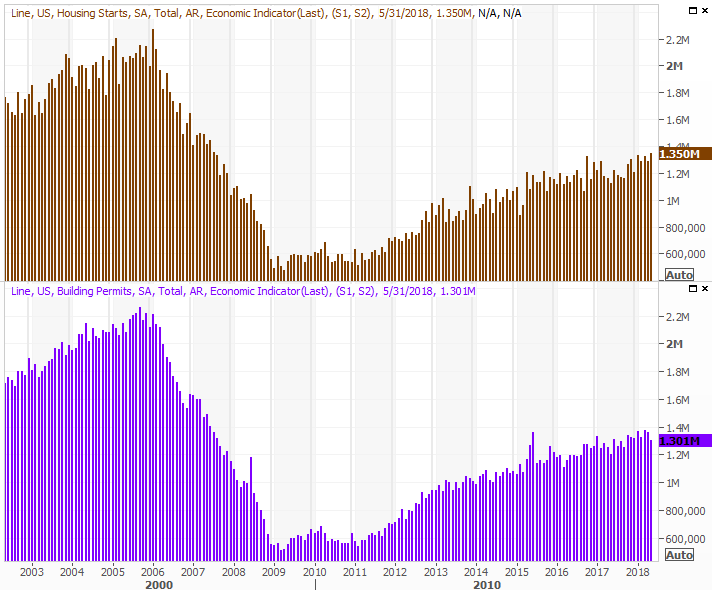
Source: Thomson Reuters
Economists aren't looking for a whole lot of progress for starts and permits totals for July. In fact, starts could actually fall a bit.
Index Analysis
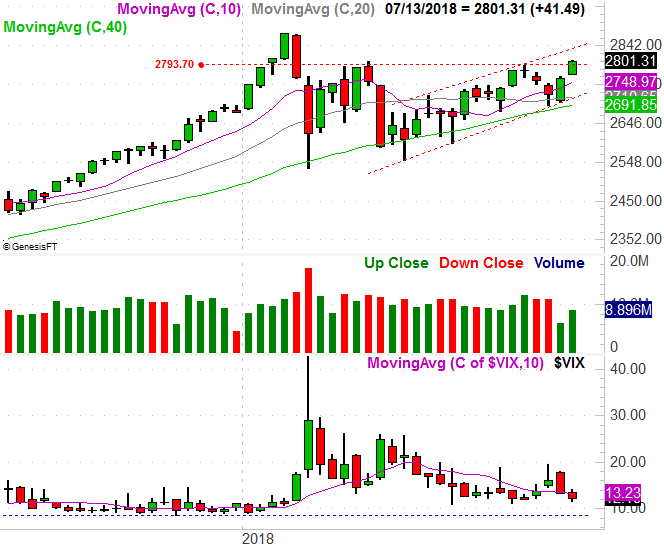
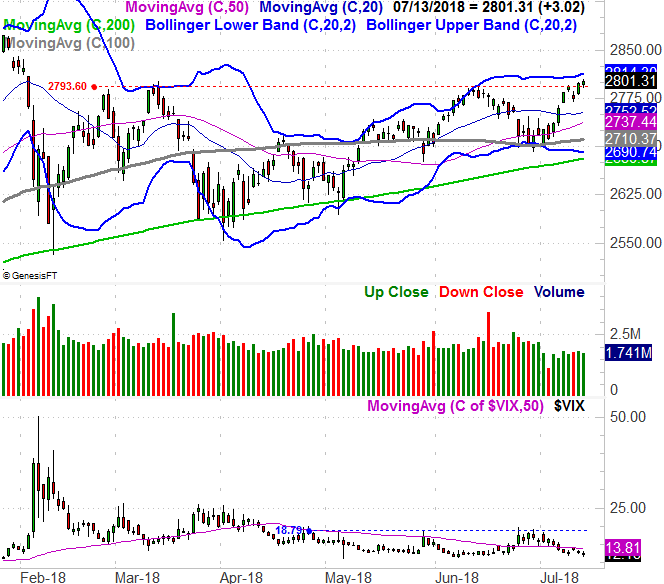
Last week's 1.5% gain from the S&P 500 not only marked the second big winning week in a row, but better still, the index pushed into new-high territory. Given the sideways movement in the months leading up to last week -- and the slow ramp-up since April's lows -- this may well be a catapult-like move with legs. The push up and off of the 100-day moving average line (gray) was right where it needed to be.
S&P 500 Daily Chart, with VIX and Volume
Source: TradeNavigator
Or, maybe it's not.
Take a look in the middle of the chart, at the volume data. Last week's volume was better than the previous week's, but the previous week was shortened by the 4th of July holiday break. In the grand scheme of things, last week's volume was light. The gain wasn't necessarily a majority opinion.
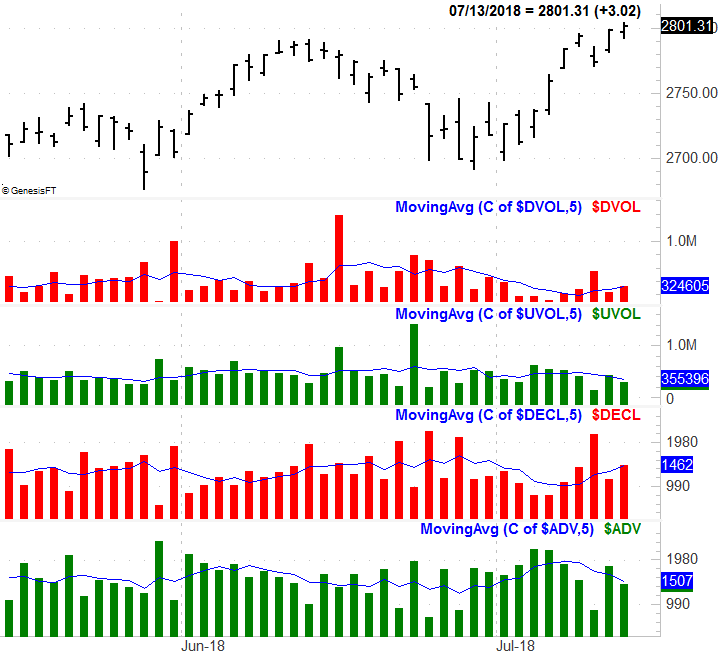
Worse, there was actually more bearish volume than bullish volume late last week and more declining stocks than advancing stocks.
S&P 500 With Up/Down Volume and Advancers/Decliners
Source: TradeNavigator
Backing out to a weekly chart of the S&P 500 puts things in perspective. It's here we can see the rising bullish channel that's been guiding the index higher since April. We're not yet testing the upper edge of that range, though we're close. The real test is what happens when we get there.
S&P 500 Weekly Chart, with VIX and Volume
Source: TradeNavigator
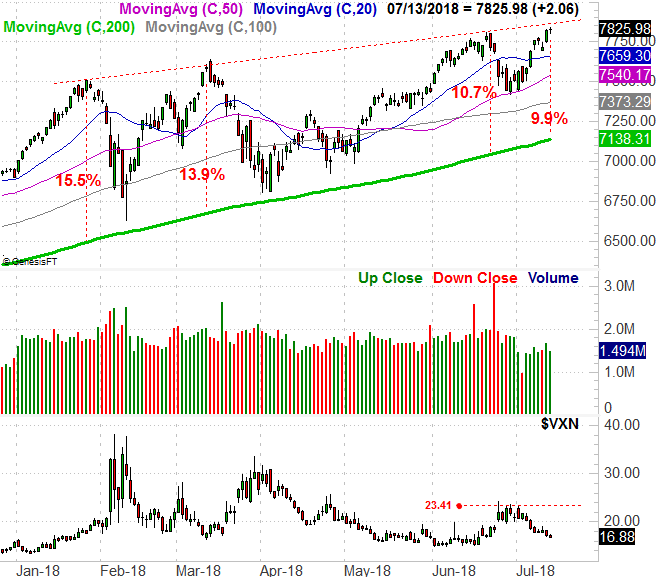
The NASDAQ Composite, for the record, looks much healthier. It hit another record high on Friday, with many technology stocks continuing their bullish romps. This is important. The NASDAQ tends to lead the market's overall charge, up and down. If it's already moved into new-high territory, other stocks and indices should be about to do the same.
NASDAQ Composite Daily Chart, with VXN and Volume
Source: TradeNavigator
So when might the NASDAQ peak, if it's not already at a short-term high? The red dashed line shows the distance between the Composite's value and the all-important 200-day moving average line (green). The current difference of 9.9% is significant, but not necessarily the end of the end. It was in January we saw the NASDAQ more than 15% higher than the 200-day moving average line.
Then again, the resistance line that's tagged all the major highs of late is just ahead. That's a detail that can't be glossed over.
Whatever the case, if we're not at the most plausible peak, we're close to it. Just don't expect a whole lot more separation before we suffer a sizeable setback, if we get any more separation at all. The S&P 500 is about to bump into its upper Bollinger band again, which has more often than not resulted in at least a slowdown if not an outright pullback.
We have to assume the trend underway will remain in motion until we can no longer maintain that assumption. As before, if the VXN (or the VIX, for that matter) doesn't start to make meaningful new highs, any setback isn't exactly an outright sell signal.