Weekly Market Outlook - Stocks Take a (Short) Ride on the COVID Vaccine Train

Most of last week's 2.2% gain was made on Monday, when the world heard there's a COVID-19 vaccine that pretty much works. Though it will be months until it's available en masse, hope is enough for now. The market held its ground through Thursday, and when push came to shove as the closing bell approached on Friday, it was the bulls doing most of the shoving. Ending the week on a high note sets the stage for a strong start this week.
Except, there's on strange nuance to Friday's gain... and for that matter, Wednesday's gain. There's still not much volume behind the advances (other than Monday's). Stocks may have logged a record high close on Friday, but a lot of things remain on the fence. We've also not really cleared a key hurdle.
We'll look at all of these things in detail below. First though, let's review last week's big economic announcements and preview the two items of interest on this week's dancecard.
Economic Data Analysis
The only economic news of interest last week as an update of the nation's inflation. Despite a rapid recovery of economic activity, plenty of dollars injected into "the system" and super-low interest rates, inflation remains surprisingly tame. The annualized rate for consumer inflation now stands at a palatable 1.2%, down from September's rate of 1.4%. On a core (not counting food and gas) basis, the consumer inflation rate is 1.6%. The producer inflation rate ticked higher last month, but at 0.5%, that's still quite muted.
Consumer, Producer Inflation Charts (Annualized)
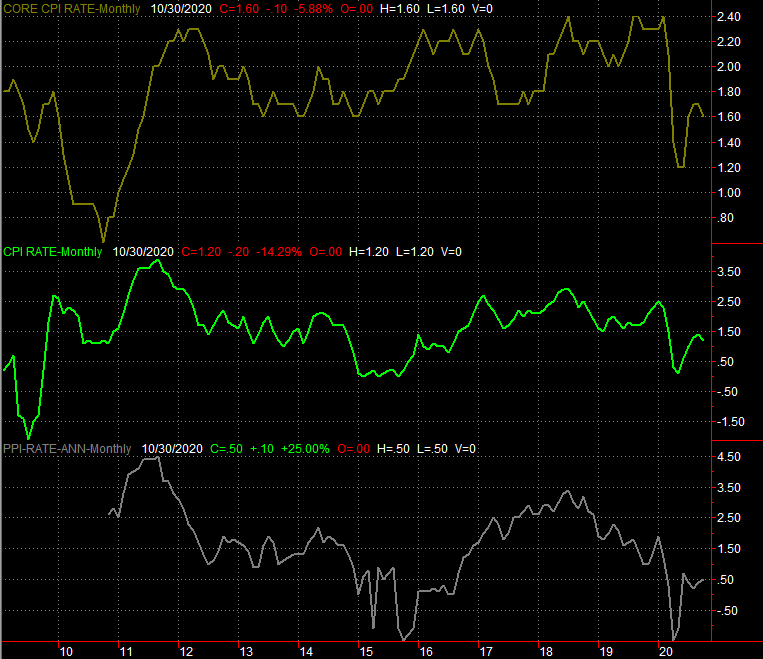
Source: Bureau of Labor Statistics, TradeStation
This should keep the Fed from imposing any quick knee-jerk effort to cool inflation that could also end up up-ending the market.
Everything else is on the grid.
Economic Data Calendar
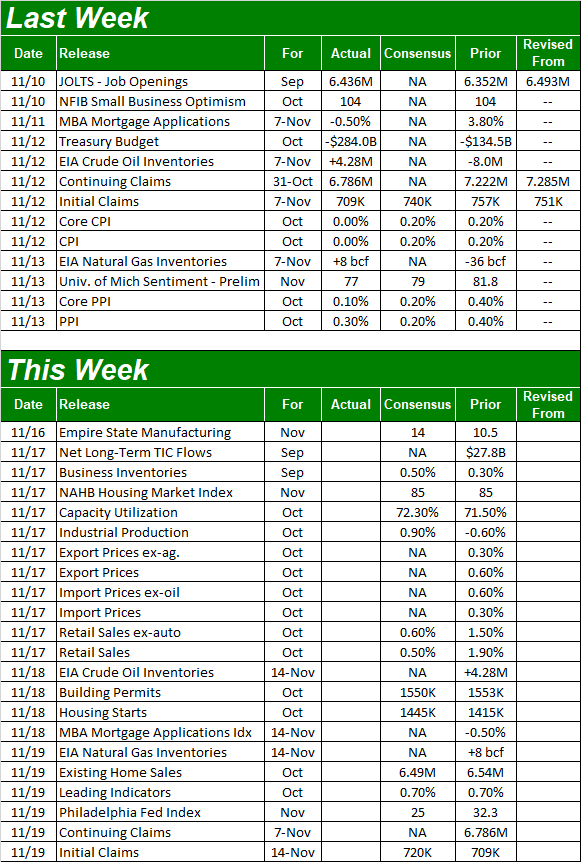
Source: Briefing.com
This week will be a busier one, and a very important one. We'll be getting true looks at how busy the country's factories are, and how confident the nation's consumers are... as measured by how much they're spending.
The former comes in the form of the Federal Reserve's reading of the United States' industrial production and how much of our production capacity we're using. Both should have inched higher from September's lull. That still won't bring us back to pre-COVID levels, but that in itself isn't terribly problematic. The trajectory is the key right now.
Capacity Utilization and Industrial Production Charts
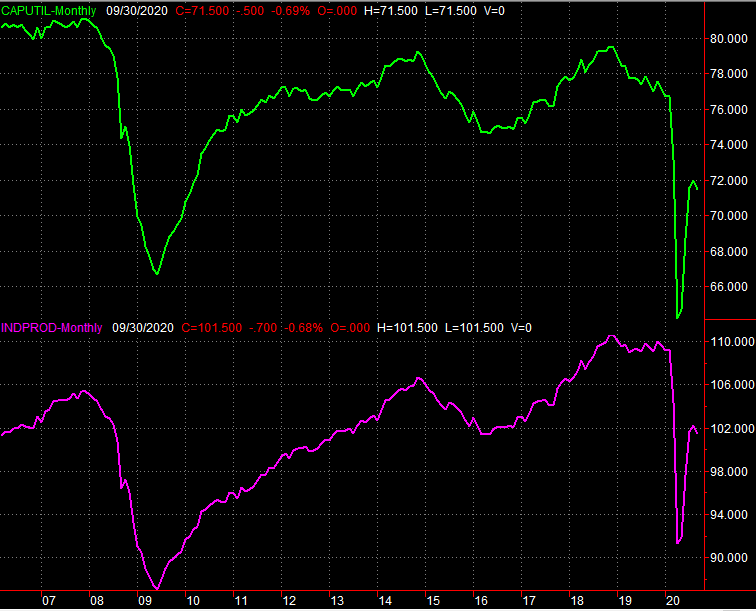
Source: Federal Reserve, TradeStation
Also on Tuesday we'll hear last month's retail spending numbers. The pace of rebound is slowing, but consider the comparison. We're almost "back to normal." In fact, total spending is back in the same tract it was in before the pandemic took hold, moving into record level territory in just the past few weeks.
Retail Spending Charts
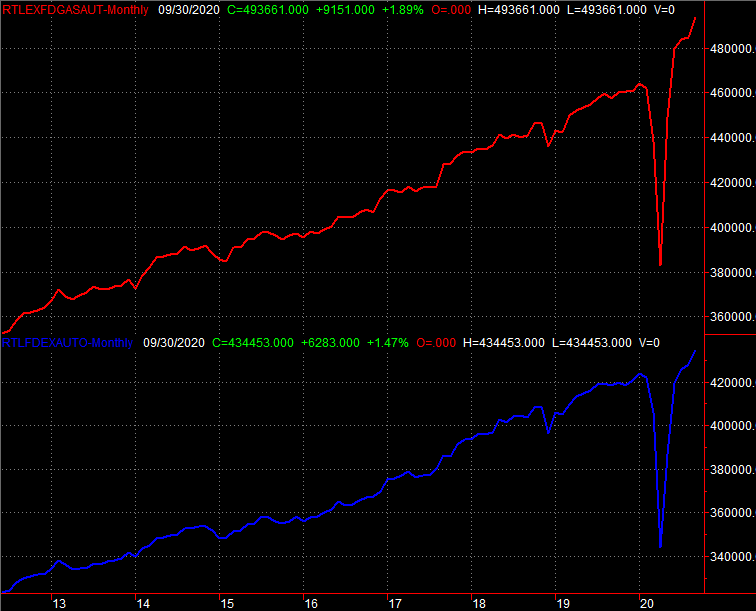
Source: Census Bureau, TradeStation
On Wednesday look for October's housing starts and building permits. Both should more or less be in line with September's reading, but September's readings were pretty solid. Consumer are taking full advantage of those low interest rates, which of course stimulates the economy.
Housing Starts and Building Permits Charts

Source: Census Bureau, TradeStation
In this vein, also look for sales of existing homes on Wednesday. The National Board of Realtors anticipates these purchases cooled just a hair last month, but as was the case with new homes, last month was particularly healthy. We'll chart the existing home sales trend a week from now when we also have new homes sales data.
Stock Market Index Analysis
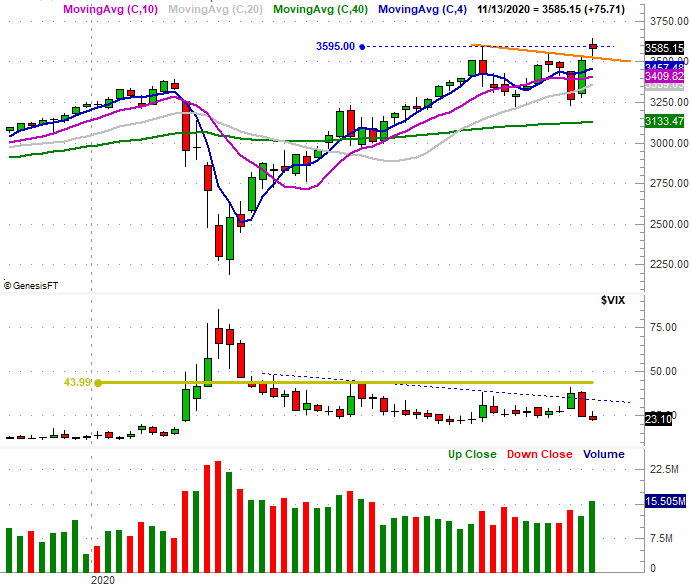
We'll once again start things out with a look at the weekly chart, just for some much-needed perspective. The S&P 500 gained 2.2% last week, but it was a move that was somewhat out of character. Not only did the market bolt to record highs, but the move hurdled a falling resistance line (orange) that has connected all the major peaks since February. Last week's low is barely below the previous week's high too, which isn't unheard of, but certainly unusual. In broader terms, there's just something "not quite right" about the move.
S&P 500 Weekly Chart, with VIX and Volume
Source: TradeNavigator
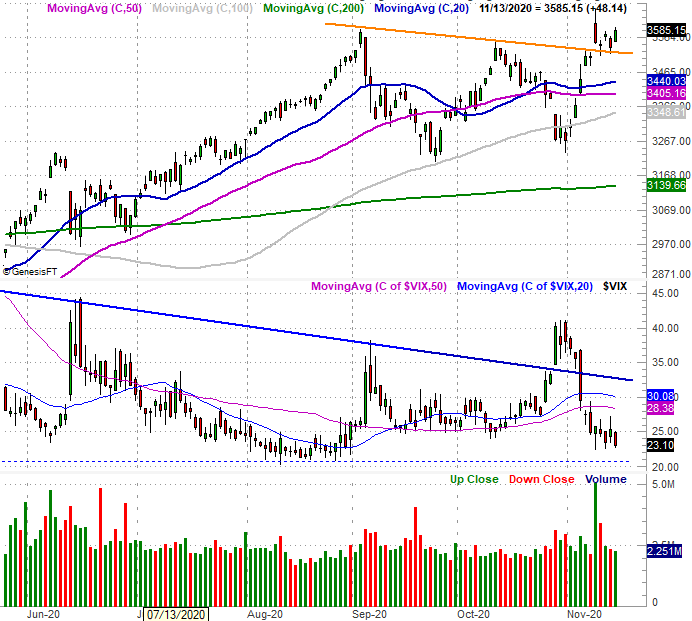
The daily chart adds some more perspective to the weekly chart. Namely, it makes clear that the bulk of the gain took shape on Monday in the wake of COVID vaccine news. Most of that intraday gain was given back by the end of the day, however, and though we saw good progress on Friday, we saw very little volume behind Friday's advance. Why? That's the big question.
S&P 500 Daily Chart, with VIX and Volume
Source: TradeNavigator
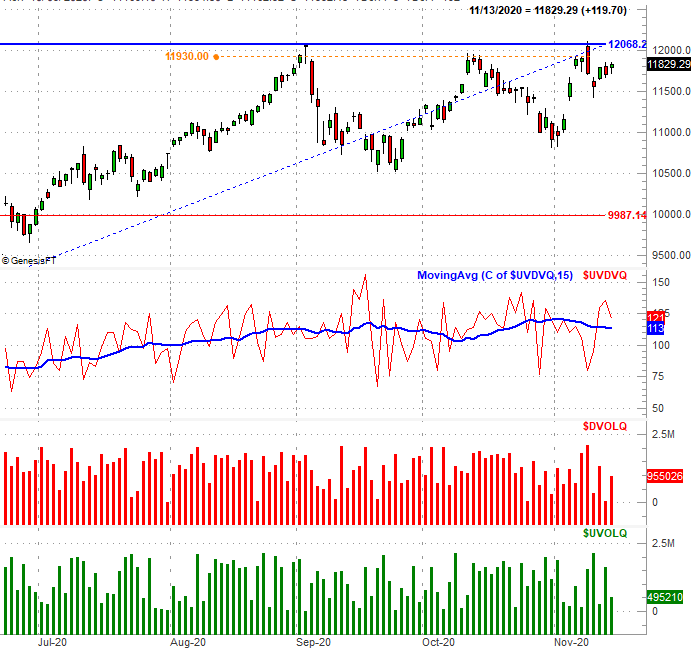
Ditto for the Dow Jones Industrial Average, and for the NASDAQ Composite. In fact, the NASDAQ is waving more red flags than that. Monday's big surge? It was all wiped away before the end of the day, and then some. We also saw a lot of selling volume that day on the NASDAQ. That's telling in and of itself.
NASDAQ Composite Daily Chart, with Bullish, Bearish Volume and Comparison
Source: TradeNavigator
That's not the chief concern regarding the composite right now, however. The bigger red flag here is the fact that the NASDAQ lagged last week's gains. The index lost 0.5% of its value last week, having never actually pushed its way into record-high territory.
NASDAQ Composite Weekly Chart, with VXN, RSI and MACD
Source: TradeNavigator
This is a problem for one simple reason - the NASDAQ Composite (overweighted by the market's most beloved tech names) tends to lead the market... higher and lower. The fact that it didn't really perform all that well last week in what was perceived to be a bullish environment is telling. To this end, it doesn't take much to realize that the RSI line is falling, as are the MACD lines. The weekly MACD lines are waffling right now - in terms of crossunders and crossovers - but the fact that the trend line (red) is sloped lower speaks volumes. On that note...
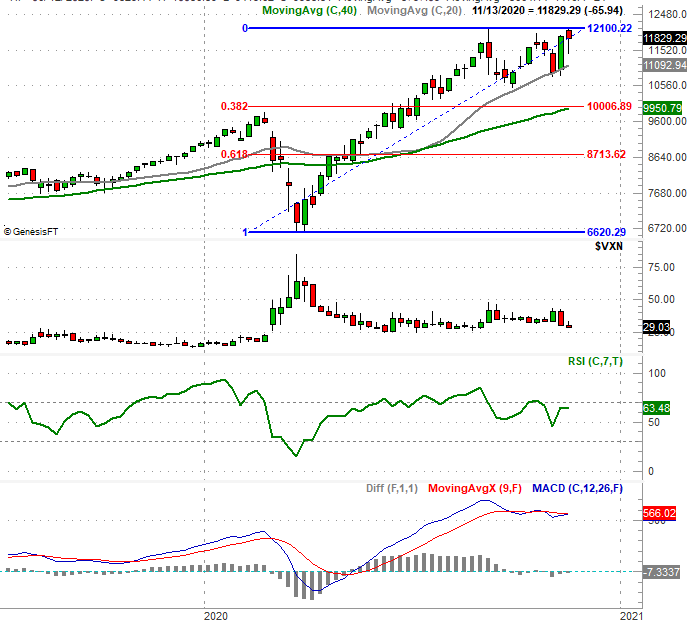
That being said, the chart we're scrutinizing the most right now is the daily chart of the NASDAQ, and more specifically, the daily chart's shorter-term moving average lines.
As is made clear below, the 20-day moving average line (blue) is back above the 50-day moving average line (purple), but the 50-day line is pointed lower. And, the 20-day moving average line could easily be pulled back under the 50-day moving average line soon. You'll also see both the 20-day and 50-day moving averages are inching closer to the 100-day moving average line (gray) suggesting momentum is slowing. If the 50-day and 20-day moving average lines cross below the 100-day line, that's a pretty solid sell signal.
NASDAQ Composite Daily Chart, with VXN

Source: TradeNavigator
For the time being, the NASDAQ Composite seems content to remain stuck in a range between 11,475 and 12,100. Let that range-bound action run its course.