Weekly Market Outlook - Stocks Squeezed Into an Inflection Point

The bulls pushed back last week, reversing course from the previous week's meltdown. But, when all was said and done, the S&P 500 failed to move back above two different crucial technical ceilings. The index also left behind a gap that's now begging to be closed... by a pullback.
Then again, given that the market is being pulled in both directions by ever-changing headlines, never say never.
We'll weigh the bullish case against the bearish case below, as always. First, let's run through last week's economic news and preview what's in store for this week.
Economic Data Analysis
Last week wasn't a terribly busy one in terms of economic news, but there was a handful of information that merits a closer look. An update of real estate prices is part of that pile.
Though not overwhelmingly or persistently so, real estate activity and interest has perked up. It suggests home prices, which have slowed their rise, might perk up again. They didn't. In fact, the S&P Case-Shiller Home Price Index only improved by 2.1% in July, on a year-over-year basis, while the FHFA Housing Price Index only improved 0.2% between May and June. The pace of progress has worsened rather than continuing on at the slower-than-usual pace seen through the first half of the year. Yes, it's concerning.
Real Estate Price Charts
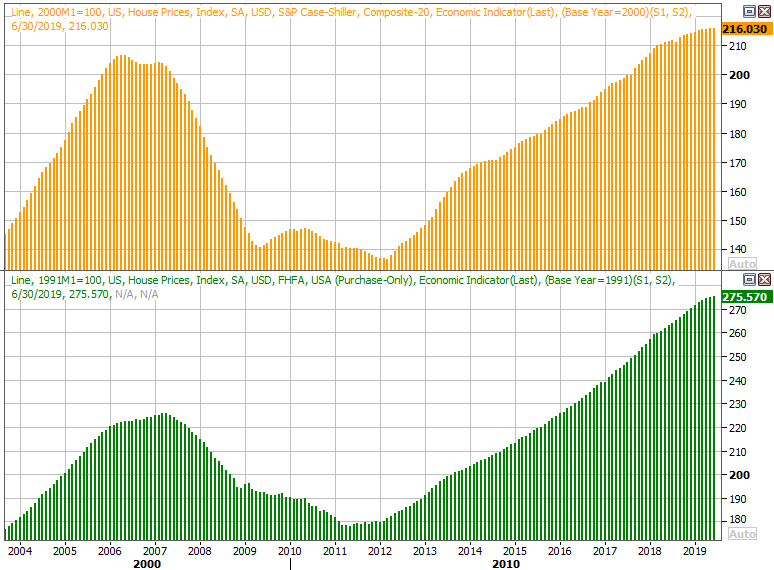
Source: Thomson Reuters
Do note that last week's updated pricing data is only through June, rather than July, meaning the information doesn't reflect the full brunt of the upside created by recently lowered interest rates. But, the current trajectory still puts pressure on the market to prove it's not fighting a losing battle going forward.
It was also a big week for consumer sentiment data. The Conference Board's consumer confidence reading rolled in at 135.1, down a bit, but much stronger than expectations. Meanwhile, the Michigan Sentiment Index fell from 92.1 to 89.8 ... a multi-year low. It may have been a fluke. But, it may also be an omen.
Consumer Sentiment Charts
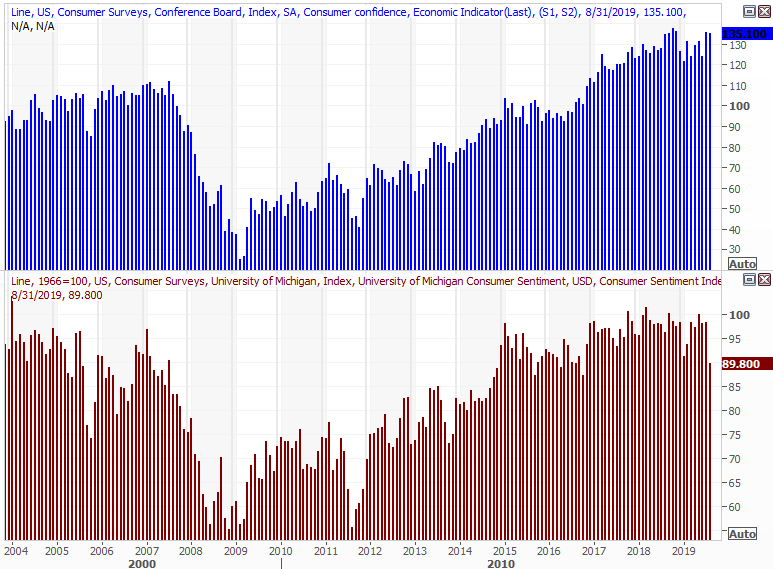
Source: Thomson Reuters
Finally, last week we started regular looks at personal income and personal spending. We're glad we did. Income growth only improved 0.1% in July, versus expectations of 0.3%, and down from June's 0.5% growth pace. Spending, meanwhile, exploded to the tune of 0.6%, up from June's 0.3%.
Personal Income, Spending Growth - YOY
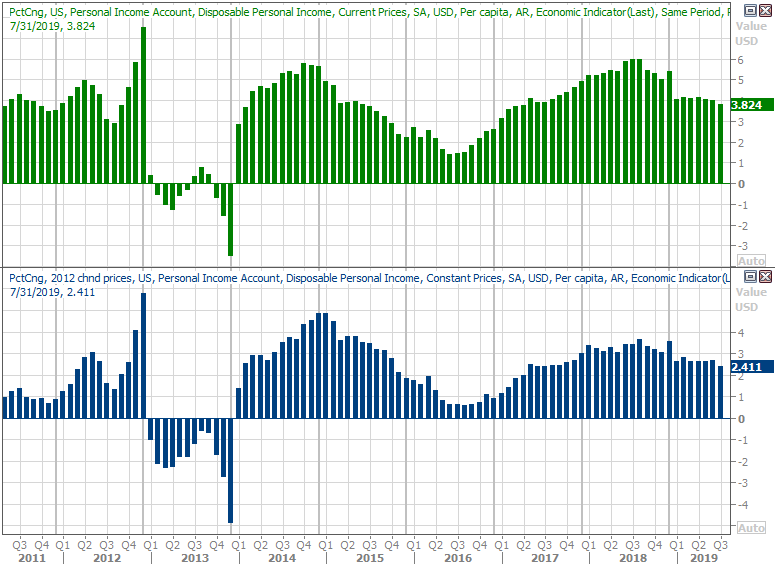
Source: Thomson Reuters
It's a curious disparity, but a hope-giving one. Consumers continue to spend money that they're not technically making. Even then though, the current annualized growth pace of both measures fell to multi-year lows. Everything else is on the grid.
Economic Data Calendar
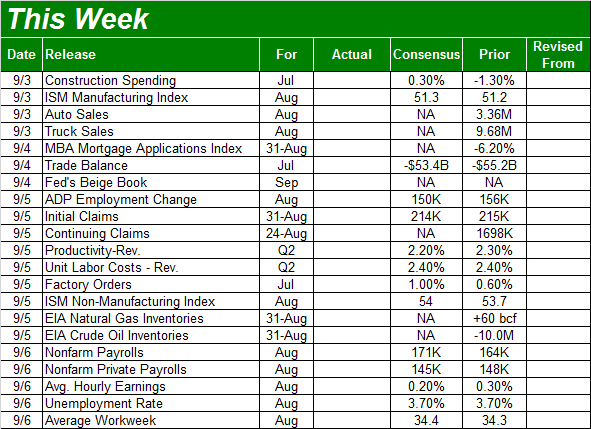
Source: Briefing.com
This week is a biggie, ending with the grand finale of August's employment report. There's a lot to sift through before we get to the finale though, starting with Tuesday's ISM Manufacturing Index report, and then the ISM Services Index figure on Thursday. The pros are looking for more of the same, on both fronts. But, that's a problem in and of itself, as both have been drifting lower for the past few months.
ISM Services, Manufacturing Index

Source: Thomson Reuters
Also on Tuesday look for last month's auto sales. It's remained level for years now, but if trucks taper off like it looks like they are, that could lead to a measured pullback in total purchases. Broad economic weakness may exacerbate that problem.
Auto Sales Charts
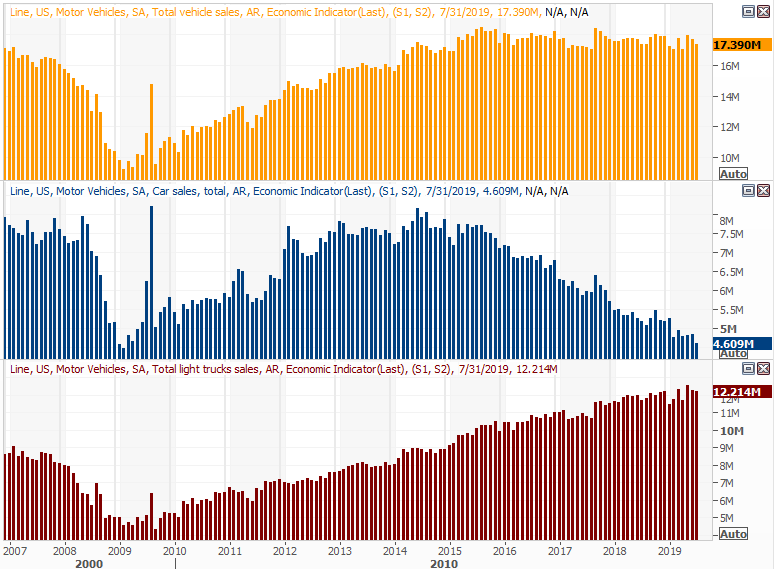
Source: Thomson Reuters
The highlight, of course, will be Friday's employment report... the highlight of this year's economic reports. It's remained strong, even if not every other economic measure has. Economists are expecting 180,000 new jobs to maintain the unemployment rate at 3.7%.
Unemployment, Payroll Growth Chart
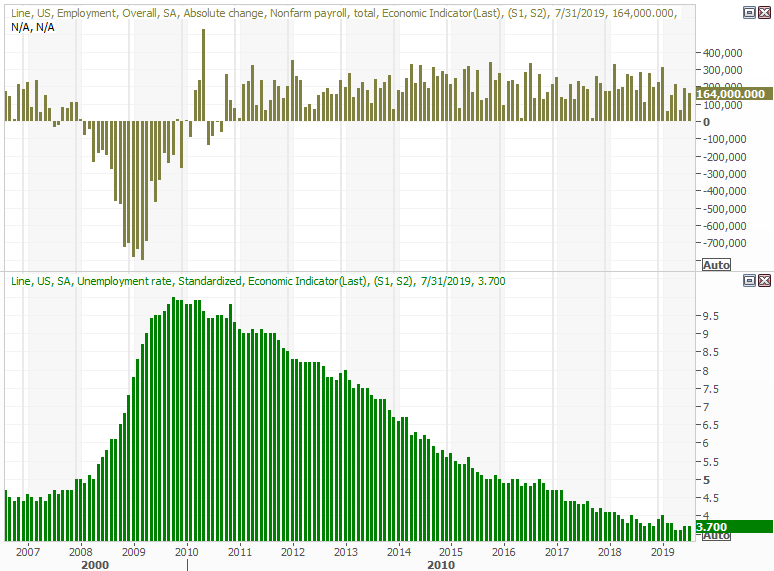
Source: Thomson Reuters
As always, we'll take a detailed look at the jobs picture at the website, examining the data that isn't covered in-depth by the media. That data, by the way, has been as strong this year as the more touted numbers like payroll growth and unemployment rates.
Stock Market Index Analysis
Last week at the website we suggested the market would be forced into a showdown... before the end of last week. That is to say, either the bulls or the bears were going to be forced to make a stand. A key support level would have to break, or a key resistance line would.
That didn't end up happening. Rather, the market managed to find a way to postpone committing to one direction or the other. The ceiling wasn't breached, nor was th floor. We were certainly pushed closer to that showdown though.
The daily chart tells the tale. A rising support line, plotted in yellow, has been established as of last week. Also confirmed last week is the establishment of the horizontal ceiling at 2939.80, marked with a red dashed line.
S&P 500 Daily Chart, with VIX and Volume
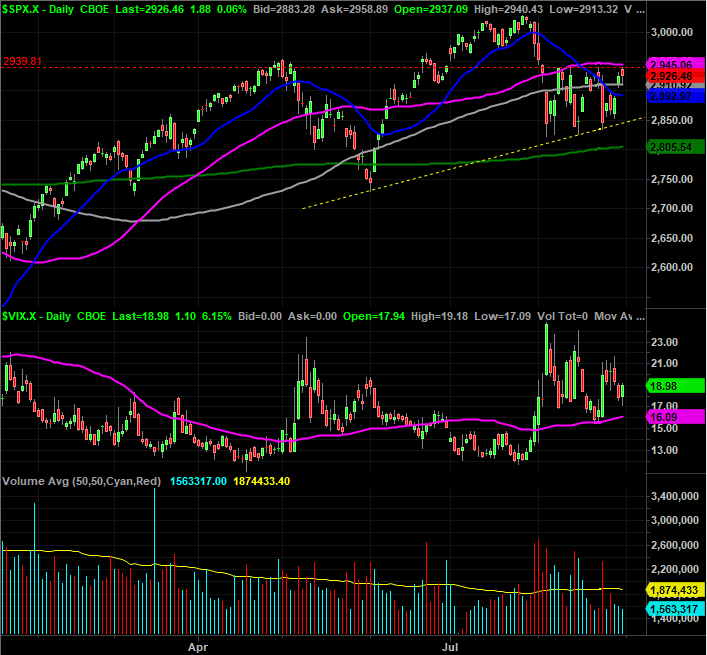
Source: TradeStation
Making matters more indecisive is the fact that Friday's action was capped at the 50-day moving average line (purple), but supported by the 100-day moving average line (gray).
Zooming out to the weekly chart puts things in perspective. Namely, it looks as if the index is being squeezed toward the point of a newly-formed converging wedge pattern. The upper boundary, of course, is plotted with a light blue line.
S&P 500 Weekly Chart, with VIX and Volume
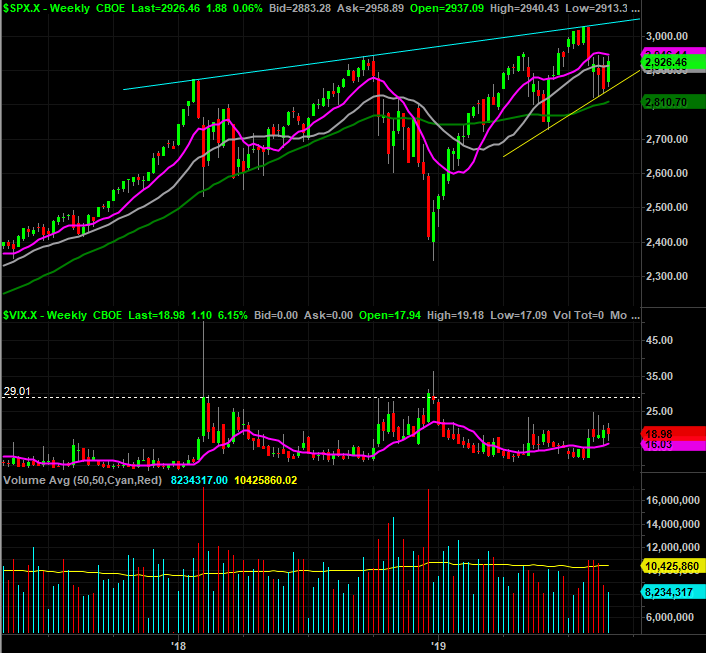
Source: TradeStation
The weekly chart, coupled with the daily chart, shows is something else that could prove troubling for the would-be bulls, however.
Take a look at the VIX on the daily chart. It was up on Friday, renewing an uptrend that was sparked by a kiss of its purple 50-day moving average line a week earlier. The weekly chart's VIX bars also suggest it's been trending upward for some time, but has yet to reach the 30-ish area that would normally be seen at a trade-worthy bottom.
It's also clear that, not unlike May's tumble, the 6% tumble from July's high to August's low wasn't really enough to be called a capitulation, or even a mini-capitulation. Ditto for the NASDAQ Composite, which is finding similar support and resistance.
NASDAQ Composite Daily Chart, with VXN and Volume
Source: TradeStation
It's also worth noting this is a bearish time of year for stocks. Thus far the bulls have defied the norm, though it's still possible traders could end up dishing out the usual weakness. That usually lasts through early October, though in this instance it's possible that weakness could persist into November.
The situation is unfurling against a very tricky backdrop as well.
There's no way of denying traders are being led, for better or worse, by headlines right now. The yield curve inversion has been interpreted as a red flag, but it's the market that made the inversion take shape. They often signal recessions, but such rampant expectations of a recession in the near future may or may not be merited. The irony: A stimulative rate cut could -- and likely would -- re-invert or further invert a yield curve.
It's also worth noting that recessions usually take shape when they're not expected. The fact that a huge swath of investors are expecting one now suggests one won't take shape. That won't prevent the market from trying to fool the masses into thinking one is inevitable though... with a steep selloff.
If we get one, watch the economic data carefully. If it remains healthy or the Fed turns up the stimulus spigot (or there's some sort of resolution to the tariff war with China), that selloff could be a buying opportunity much like the one in December was.
In the meantime, watch the boundaries established by the newly-formed converging wedge, as well as the 200-day moving average line at 2805. It's a make-or-break line right now as well.