Weekly Market Outlook - Stocks Are Oh-So-Close
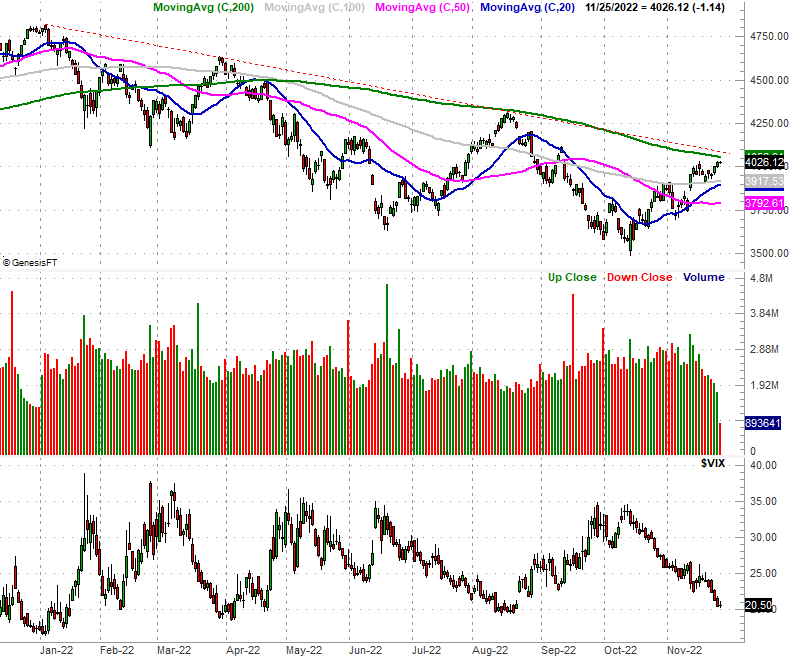
It was the usual lethargic Thanksgiving week, with most investors taking some extra time off. But, what little action we got was more bullish than not. The S&P 500 advanced 1.5% last week; other indices also made gains. In most cases, however, those gains weren't quite enough to get them firmly up and over their current technical ceilings.
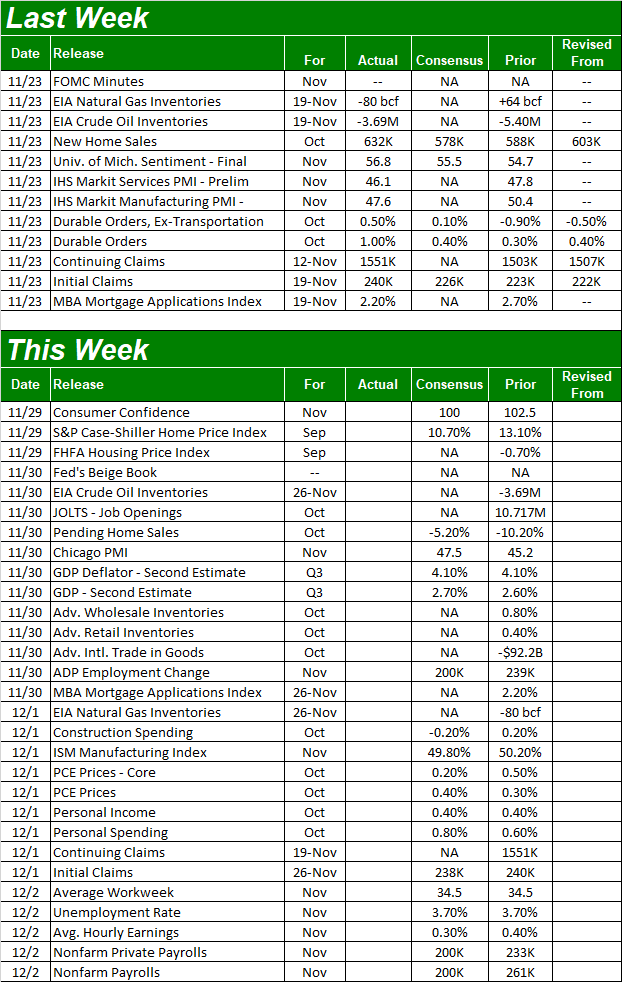
We'll look at them in detail below. First, let's recap last week's biggest economic announcements, most of which when unnoticed because they were posted on Wednesday, when investors weren't interested.
Economic Data Analysis
Wednesday's release of the minutes from the most recent FOMC meeting told us largely what was expected. That is, at least some of the Fed's governors feel the central bank will soon be able to embrace a more dovish, less hawkish stance on inflation and interest rates. The FOMC's plans are still relatively vague and open-ended though, because they have to be.
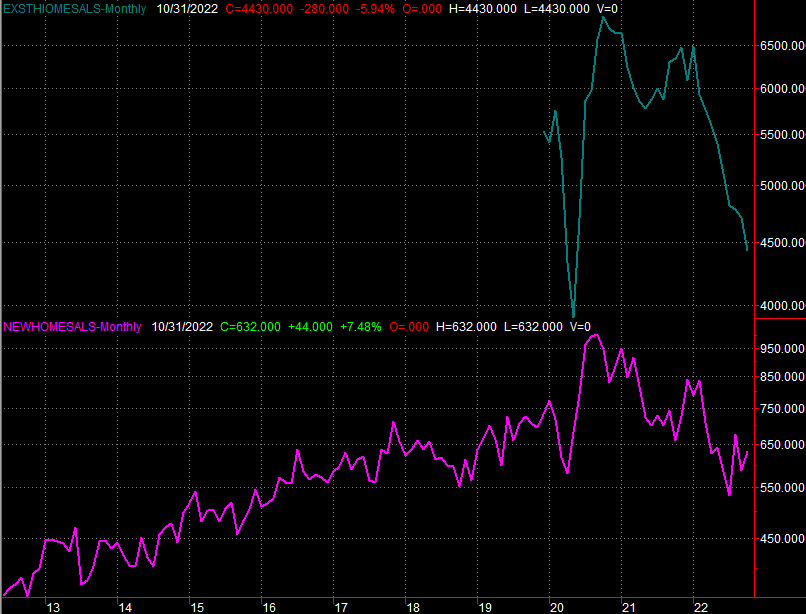
Last month's new home sales were surprisingly higher, growing from September's revised pace of 588,000 to a clip of 632,00; a slight Iull in mortgage rates helped. That's still a relatively weak figure though, and bear in mind last month's sales of existing homes plummeted (again) to a low only seen in early 2020, when the pandemic was first shutting down all commerce.
Home Sales Chart Charts
Source: National Association of Realtors, Census Bureau, TradeStation
Overall sentiment also stumbled last month. The third and final look at the University of Michigan Sentiment Index showed us a score of 56.8, down from October's figure of 59.9. The setback seems like it's undermining a recovery effort that hasn't had much of a chance to get started.
Consumer Sentiment Charts

Source: Conference Board, University of Michigan, TradeStation
The Conference Board's consumer confidence report for November is scheduled for Tuesday of this week. Look for a slight lull here as well, when the bigger trend is also pointed downward.
Everything else is on the grid.
Economic Calendar
Source: Briefing.com
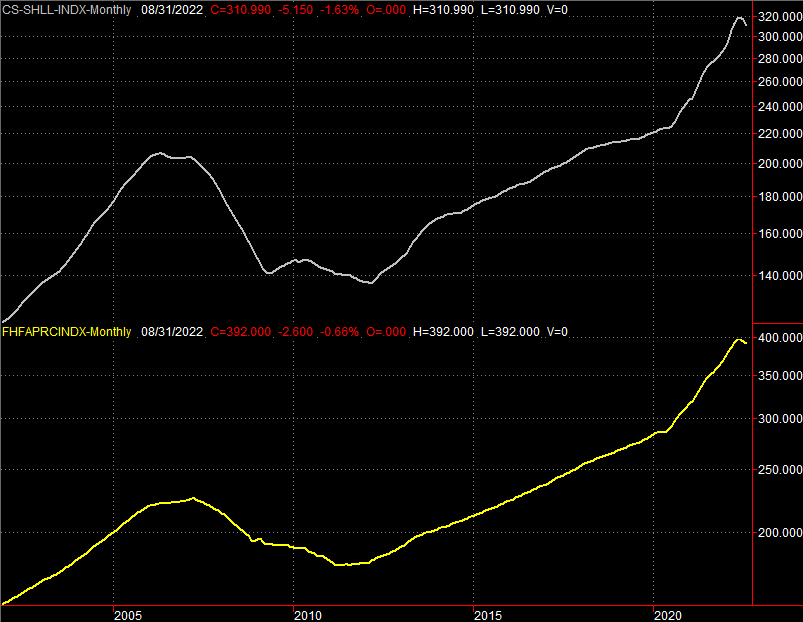
In addition to November's consumer confidence report, this week is a another big one for real estate... real estate prices to be specific. Look for the S&P Case-Shiller Home Price Index as well as the FHFA Housing Price Index reports to both be posted on Tuesday. Economists believe they fell once again in September, underscoring the broader brewing weakness on the real estate front.
Home Price Charts
Source: Standard & Poor's, FHFA, TradeStation
On Wednesday look for the second estimate of Q3's GDP growth rate, which is apt to roll in at a respectable 2.7%. On Thursday we'll hear the ISM Manufacturing Index update for November... and it could be a problem. Forecasters are saying it won't just fall again, but this time will fall under the key 50 level that differentiates between growth and contraction. The ISM Services Index will be posted next week, although it's apt to be moving in the same problematic direction.
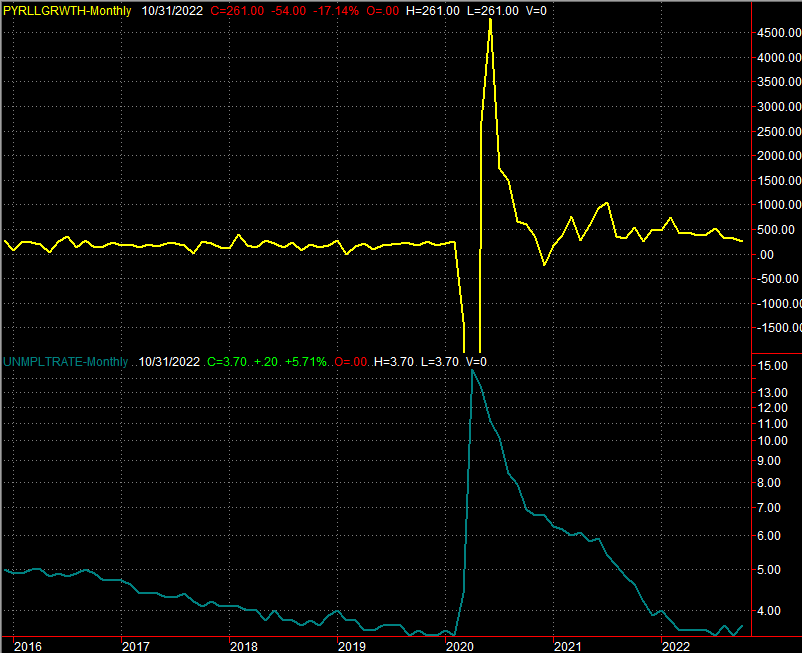
This week's biggie, of course, is Friday's jobs report. Economists believe the nation added 200,000 new payrolls this month, but that won't be enough to lower the unemployment rate from its current level of 3.7%.
Payroll Growth and Unemployment Rate Charts
Source: Department of Labor, TradeStation
Notice that job growth has been slowing for some time. That's not a huge deal given that the unemployment rate is as low as it is. If job growth is disappointing or if the unemployment rate is allowed to start edging higher though, this data could turn into a liability in a hurry.
Stock Market Index Analysis
Last week was a win for the bulls, but the gain hardly suggests we can blindly expect more of the same going forward.
Take a look at the daily chart of the S&P 500 below. The index followed through on its push up and off of the 100-day moving average line (gray) from two weeks back. The index didn't, however, hurdle its 200-day moving average line (green) at 4066 that's capped rebound efforts a couple of times since April. The S&P 500 also didn't move above the straight-line ceiling (red, dashed) that connects all the key peaks going back to January's. Until the index can clear both hurdles -- the upper one of which is currently at 4082 -- the S&P 500 isn't exactly back in full-blown bullish mode.
S&P 500 Daily Chart, with VIX and Volume

Source: TradeNavigator
And, doing that may prove even tougher than it seems with just a quick glance at the daily chart of the S&P 500. The weekly chart shows us why. In this timeframe we can see the volatility index, or VIX, is now bumping into a rather well-established technical floor. If the recent-past patterns hold up, this is where the bulls yield back to the bears.
S&P 500 Weekly Chart, with VIX and Volume

Source: TradeNavigator
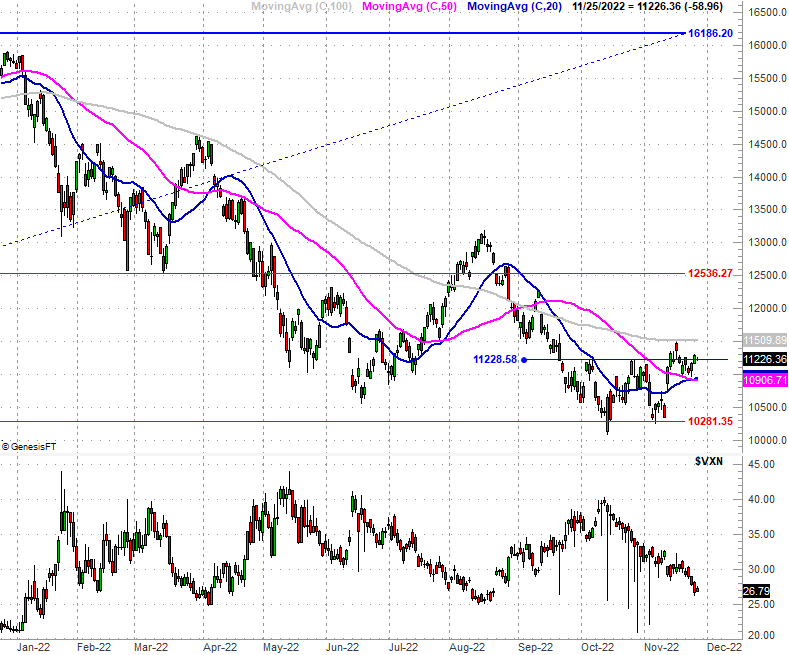
The NASDAQ Composite is faring slightly better, but only slightly. Like the S&P 500, the composite is pushing up and off of its now-converged 20-day and 50-day moving average lines at 10,909, but is still below the 100-day moving average line (gray) at 11,510 that stopped the rally a couple of weeks back. Underscoring this indecision is the fact that last week's close of 11,228 is right at the peaks made a couple of times last month. The index is very much on the fence.
NASDAQ Composite Daily Chart, with VXN
Source: TradeNavigator
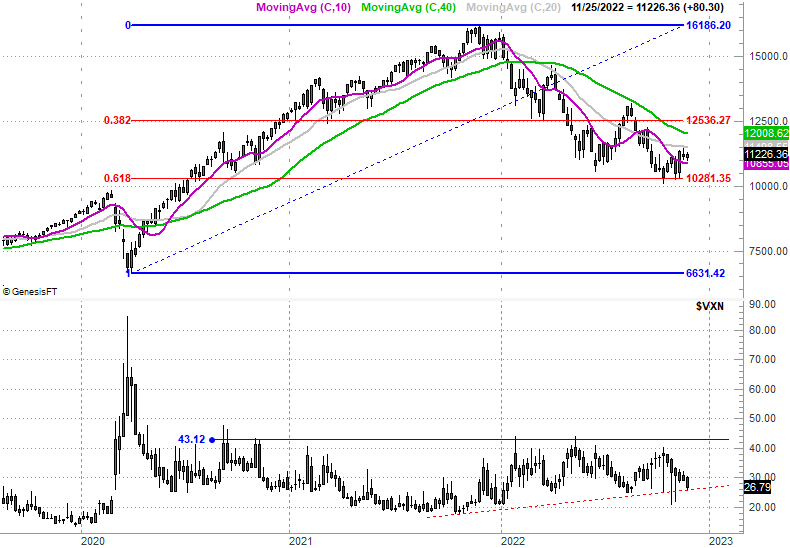
As was the case for the S&P 500 though, the weekly chart of the NASDAQ Composite makes clear that its volatility index is now touching a major support level of its own (red, dashed). Again, there's good reason to expect bearish pressure to materialize right here and right now.
NASDAQ Composite Weekly Chart, with VXN
Source: TradeNavigator
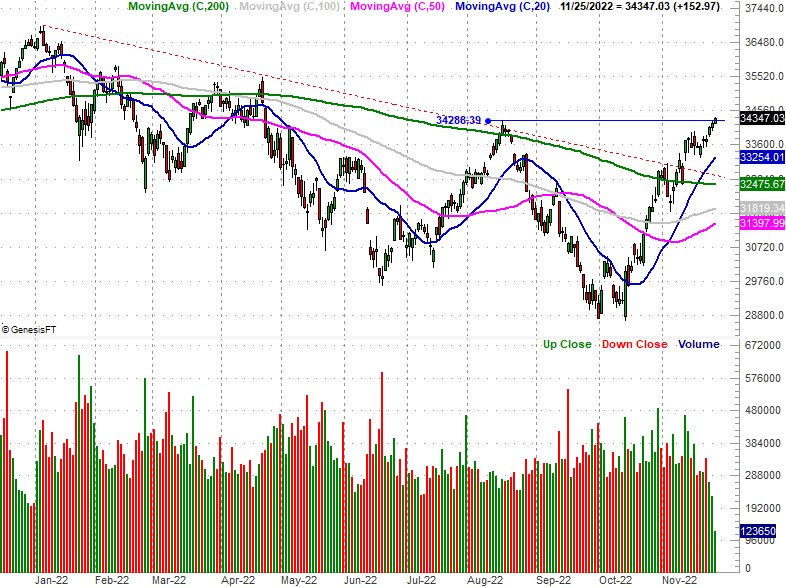
The only index to make any real technical progress last week is the Dow Jones Industrial Average. As you'll see, it edged to just above August's high of 34,288, putting some distance between itself and the major technical ceiling around 33,000 that was hurdled early this month. This may reflect a broad "flight to safety" strategy in what's otherwise been a bearish rough patch.
Dow Jones Industrial Average Daily Chart, with Volume
Source: TradeNavigator
This flight to safety, however, is ultimately a warning rather than a reprieve; all stocks tend to move in the same basic direction, even if not to the same degree. The bulls still have more to prove than the bears do. Remain on the lookout here, as a bunch of activity that was postponed last week will materialize this week. Keep watching the aforementioned technical ceilings.
