Weekly Market Outlook – Stocks Are Just Waiting For Their Next Cue

Things were going swimmingly enough for the bulls last week… until Friday. Thanks to that day’s 0.64% setback, the S&P 500 ended up losing just a little ground for the week.
Except, maybe the market’s bigger picture bullish momentum is slowing anyway. It’s just slowing down by way of significant setbacks once every few days. The fact that enough bears continue to dish them out speaks volumes.
One lousy ending to one week isn’t disastrous; the index is still holding above all of its key moving average lines serving as technical support. The rally is running out of steam though.
We’ll look at this slowdown and make-or-break levels in a moment. Let’s first run through last week’s economic news and preview what’s coming this week.
Economic Data Analysis
The big week of real estate date kicked off on Monday with a look at July’s sales of new homes. You may recall from a week earlier that sales of existing homes actually ticked up just a bit last month. But, that gain was lost with the slight lull in new-home sales. Mostly though, notice that both measures remain stuck in ruts near multiyear lows.
Home Sales Charts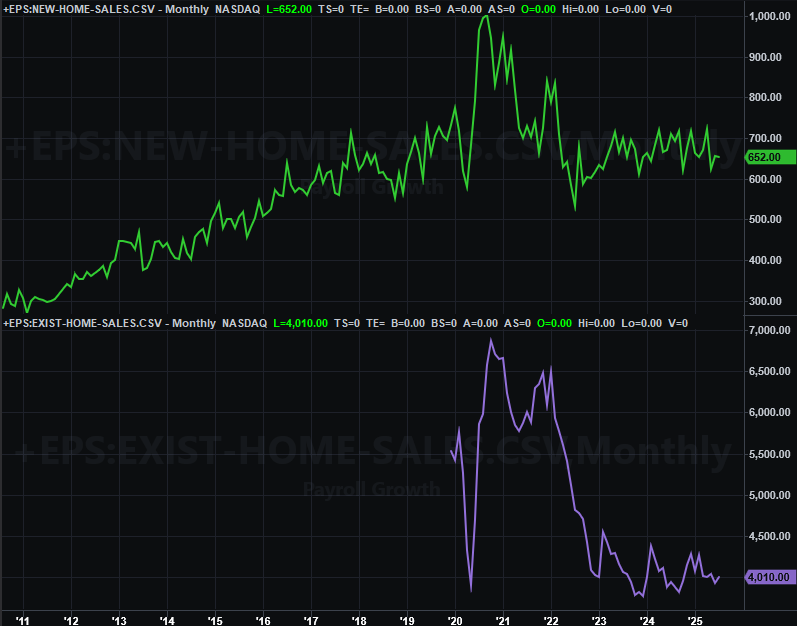
Source: National Association of Realtors, Census Bureau, TradeStation
In light of this lingering non-growth in terms of sales, it should come as no real surprise that it’s finally taking a toll on home prices. The Case-Shiller Index -- which has been wobbly since 2022 even if broadly on the way up -- fell just a bit, while the FHFA Home Price Index continued to trek lower since February’s peak.
Home Price Index Charts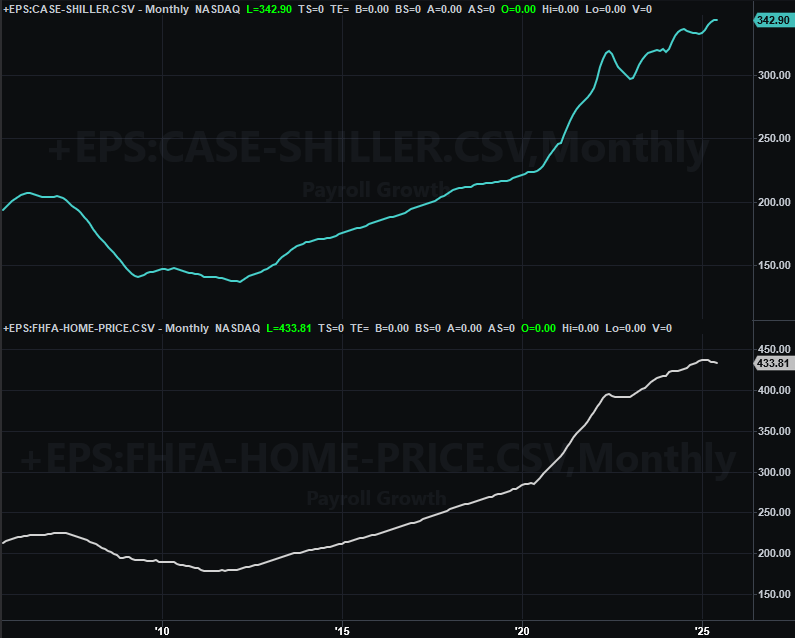
Source: Standard & Poor’s, FHFA, TradeStation
Is this the beginning of the correction of a longstanding pricing problem? It’s impossible to know for sure, but yes -- it probably is. It will likely prove to be a drag on the overall market. It’s a necessary correction the long run though.
While not (yet) shown on our chart below, both the Conference Board’s measure of consumer confidence and the University of Michigan’s sentiment index fell just a little bit for August, reversing what looked to be early rebound efforts.
Consumer Sentiment Charts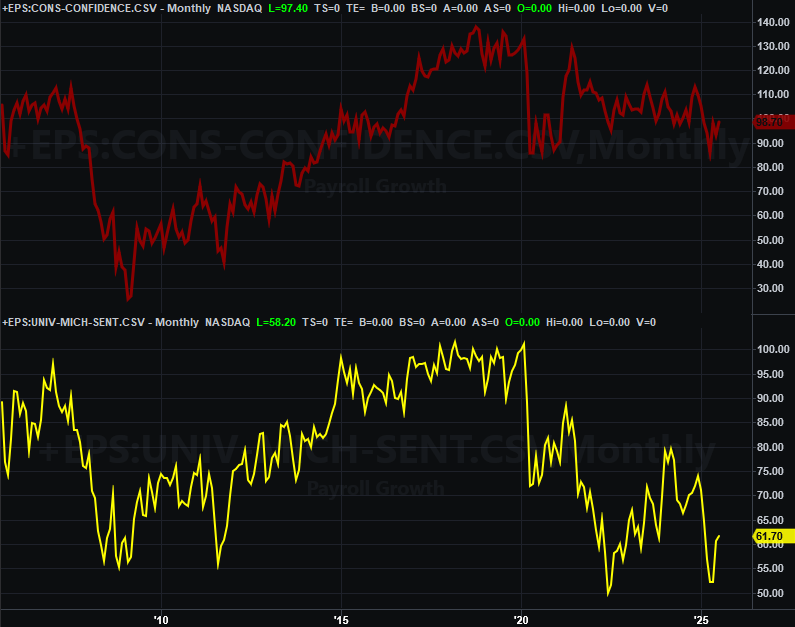
Source: University of Michigan, The Conference Board, TradeStation
It’s not exactly the end of the world. The bigger frustration on the confidence front is still that both data points are still near longer-term lows, and not making any real prolonged progress.
Finally, although we’re not charting it here, know that on Friday we heard last month’s personal income and consumer expenditure reports from the Bureau of Economic Analysis… data that has a major bearing on what the Federal Reserve does with interest rates. The fact that incomes and outlooks both continued to grow just as much as expected is the chief reason stocks ended the week on a sour note. This lowers the odds of a rate cut in the month ahead.
Everything else is on the grid.
Economic Data Report Calendar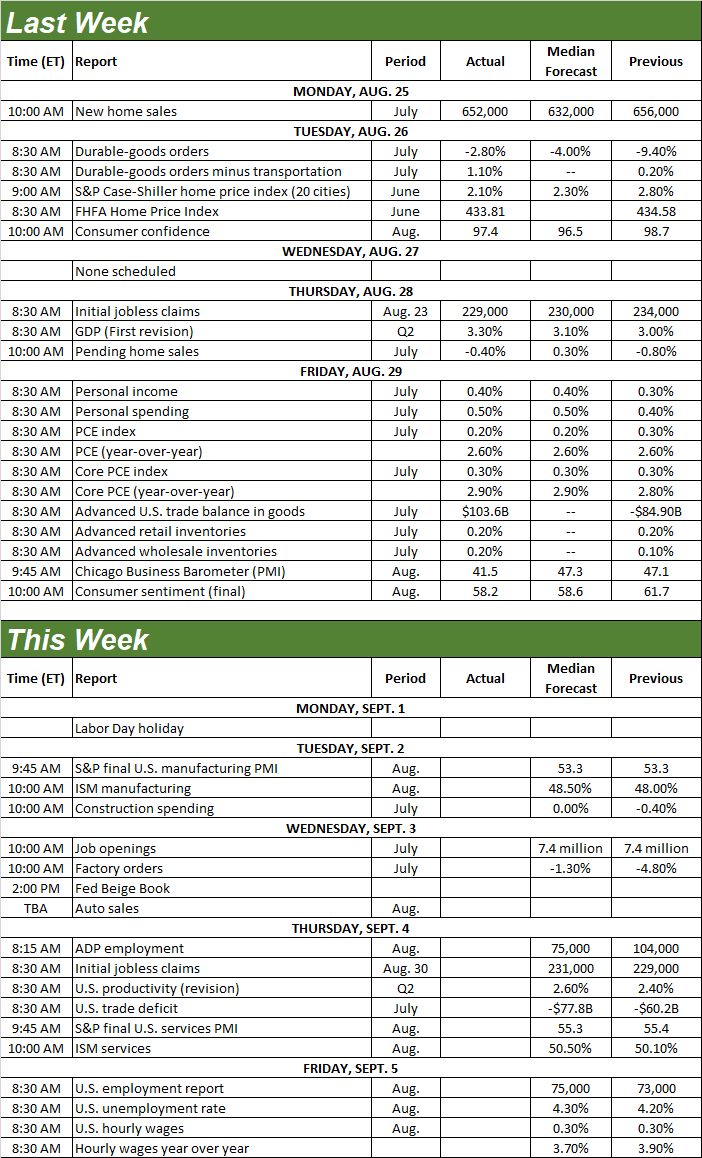
Source: Briefing.com, TradeStation
This holiday-shortened week will still be cram-packed with a lot of economic news, beginning with Tuesday’s ISM Manufacturing report. Economists are looking for an improvement on July’s number, but not enough of an improvement to push the index back above the pivotal 50 level.
ISM Services, Manufacturing Index Charts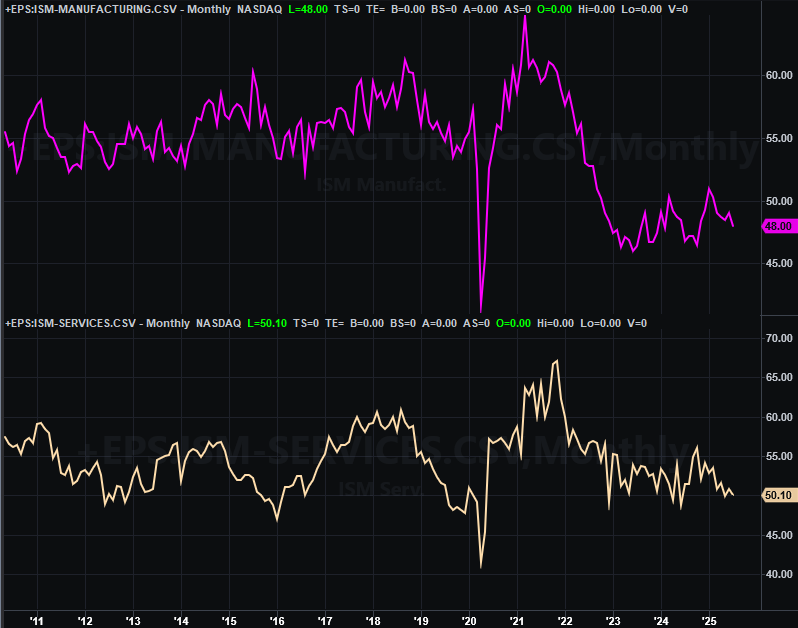
Source: Institute of Supply Management, TradeStation
The ISM Services Index will be updated on Thursday, and like its manufacturing counterpart, is likely to edge higher for August as well. Just note that the services barometer is already above 50. In neither case, however, will the expected slight uptick be enough to change the fact that both data sets are in a bigger-picture decline.
Things don’t start rocking in earnest again until Friday, with August’s jobs report (although we’ll see a decent preview of this data with Thursday’s ADM employment report). You might remember things turned a little worrisome a month ago, with payroll growth of only 73,000 jobs allowing the unemployment rate to edge back up to 4.2%. Economists aren’t looking any better this time around.
Unemployment Rate, Payroll Growth Charts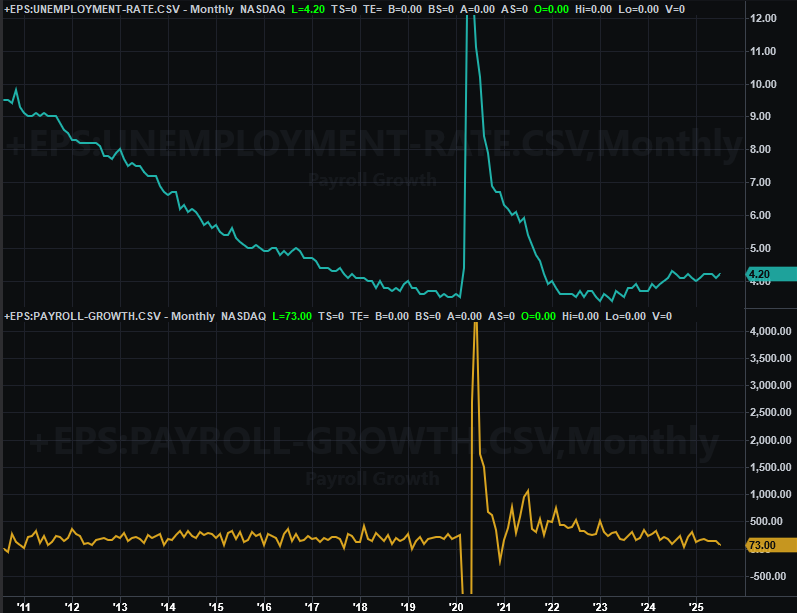
Source: Census Bureau, TradeStation
Of course, with the bar being set as low as it is, anything that’s better than the forecasts could lift the market… unless traders believe a healthy jobs report is yet-another reason to doubt an interest rate cut is in the cards.
Stock Market Index Analysis
The walls are closing in on the indexes, and the S&P 500 in particular. That is to say, the index is stuck under a well-established technical ceiling, but holding above an increasingly-better-established technical floor. The problem is, the floor and ceiling are converging, leaving the index less and less room to move. Sooner or later – and sooner than later – something’s got to give. Either the bulls or the bears are going to have to commit to a move. And given the circumstances and time of year, it feels like it’s going to be the bulls that flinch, ceding control of things to the bears.
The support we’re talking about is best-illustrated on the daily chart of the S&P 500. As is marked by yellow arrows, the index has now successfully tested a rising floor (red, dashed) four times now since late May. It’s still above this line too, as well as still above the 20-day moving average line (blue) currently at 6,420. As long as the S&P 500 is above these marks, the trend is still technically bullish even though Friday’s weakness led the index back into the red for last week.
S&P 500 Daily Chart, with Volume and VIX 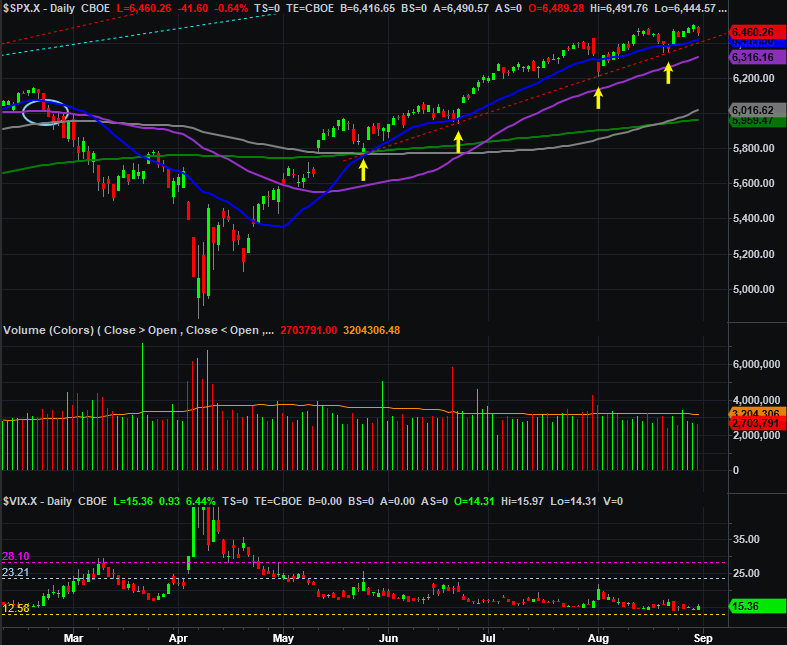
Source: TradeNavigator
The weekly chart tells the same story from a different perspective. As you can see, the S&P 500 is still testing -- but not hurdling -- the technical resistance line (yellow, dashed) that was previously the lower boundary of the rally since late-2023. It’s still moving higher, to be clear (although it suffered a small loss last week). But, it’s a cautious, hesitant rally.
S&P 500 Weekly Chart, with MACD and VIX 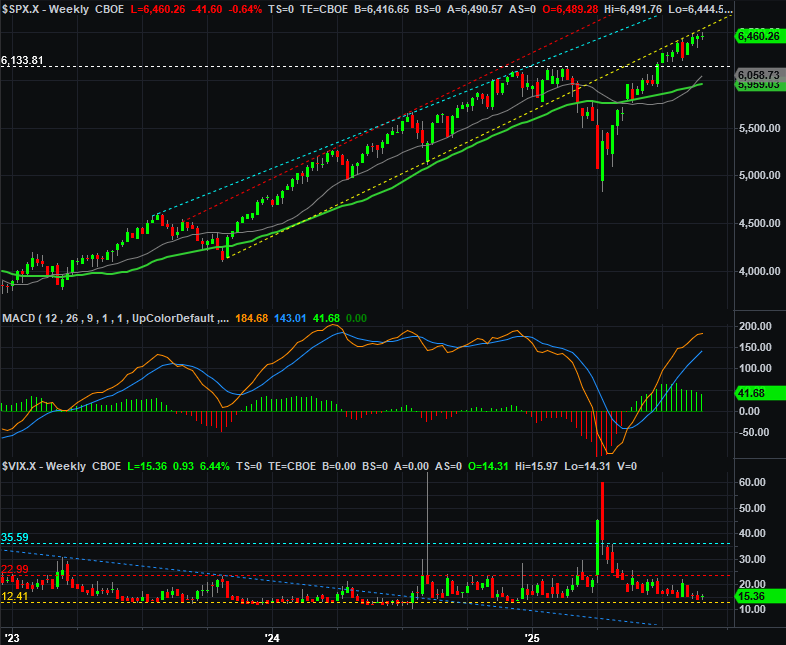
Source: TradeNavigator
There’s something else curious on the weekly chart as well… sort of. Although it’s not yet flipped to an outright bearish condition, notice that the MACD lines in the middle of the weekly chart above are starting to converge, confirming there’s at least some slowing of the rally (although this is visually noticeable with just a look at the S&P 500’s recent weekly bars anyway).
The weekly chart of the NASDAQ Composite looks similar to the S&P 500’s, but is arguably more extreme. Last week’s small loss is the second weekly loss in a row, and it certainly seems like it peaked three weeks back after suffering some slowing momentum of its own.
NASDAQ Composite Weekly Chart, with MACD and VXN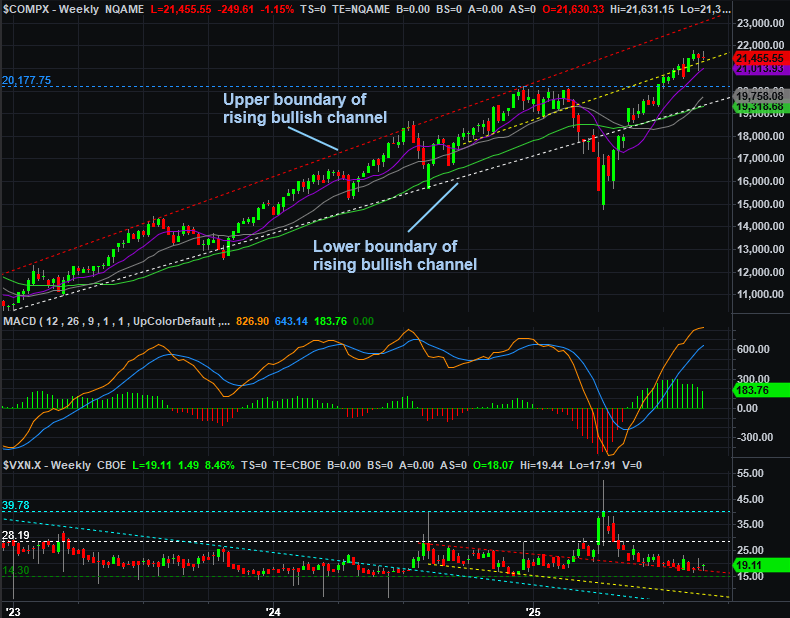
Source: TradeNavigator
The thing is, a pullback here might actually be the best thing in the long run.
See, September is historically one of the worst months for the market, with the S&P 500 losing an average of 0.82% for the month ahead. That doesn’t seem so bad. Just bear in mind that’s an average of all the data. Actual setbacks are on the average of 4% to 5% (and sometimes more), and we’re more likely to see a loss than a gain of any size. Moreover, these losses tend to materialize in the wake of sizeable runups like the one we’ve seen since April.
S&P 500 2025 Performance Comparison to Average Day-to-Day Annual Performance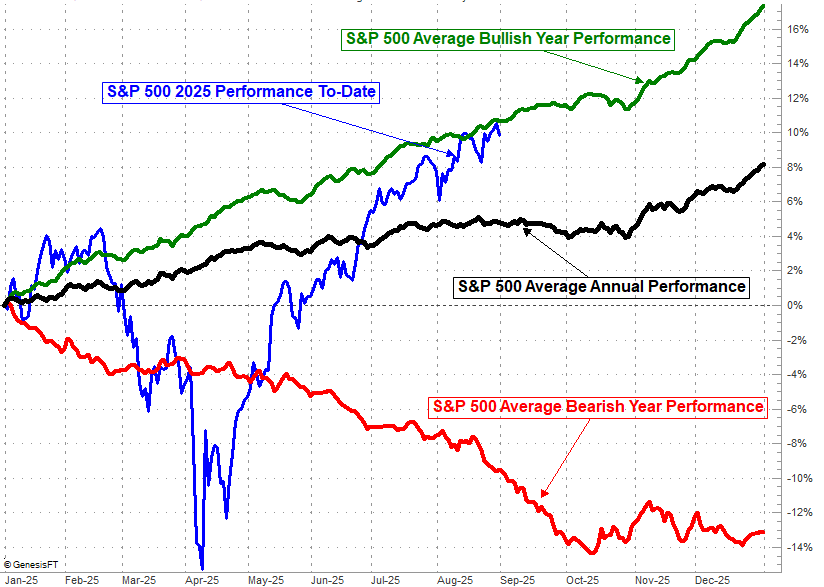
Source: TradeNavigator
The upside is, as you can see this September swoon typically sets up a nice year-end rally that typically begins in the middle of October.
This isn’t to say that’s what’s going to happen this time around. As was noted, both of the indices are still in net-bullish mode by virtue of both still holding above even the shortest-term of their moving average lines. Those lines would need to fail as a floor first before we can ever even actually entertain the prospect of a bigger-picture pullback. And, as you can also see, in bullish years the month ahead isn't actually a loser. September is typically only an extreme loser in the midst of bearish environments.
Given the bulls’ growing struggle though, this is an idea we must absolutely keep on our radar. Conversely, it’s difficult to see how the market could tack on more gains here, particularly in light of how little volume there is behind any of its “up” days.