
Weekly Market Outlook – Still Too Soon to Get Excited

The bulls came back with a vengeance after a slight pullback the week before, rekindling the reversal effort that took shape three weeks back. All told, the S&P 500 rallied 4.2% last week (and 8.1% from its intraweek low) to close at 5,525.21, which is more than 14% better than its early-April low.
And yet, it’s still too soon to say the market is back in full-blown bullish mode. That’s how deep February’s and March’s cuts were. Even with last week’s big win, the market’s still nowhere to being back above any of its most important trend lines. So, this is nothing more than a dead-cat bounce… probably.
We’ll take a detailed look at it all in a moment. Let’s first work through last week’s most important economic news and preview what’s in the lineup for this week.
Economic Data Analysis
It wasn’t a terribly big week in terms of economic announcements, but we did get a couple of biggies. It was a particularly important week for real estate news, for instance, with last month’s new home sales being released on Wednesday, with sales of existing homes for March being reported on Thursday. Sales of new homes jumped quite a bit, but sales of existing homes fell even more than anticipated. Broadly speaking though, both remain stagnant at subdued levels (although it’s somewhat arguable that new home sales are making slight recovery progress).
New, Existing Home Sales Charts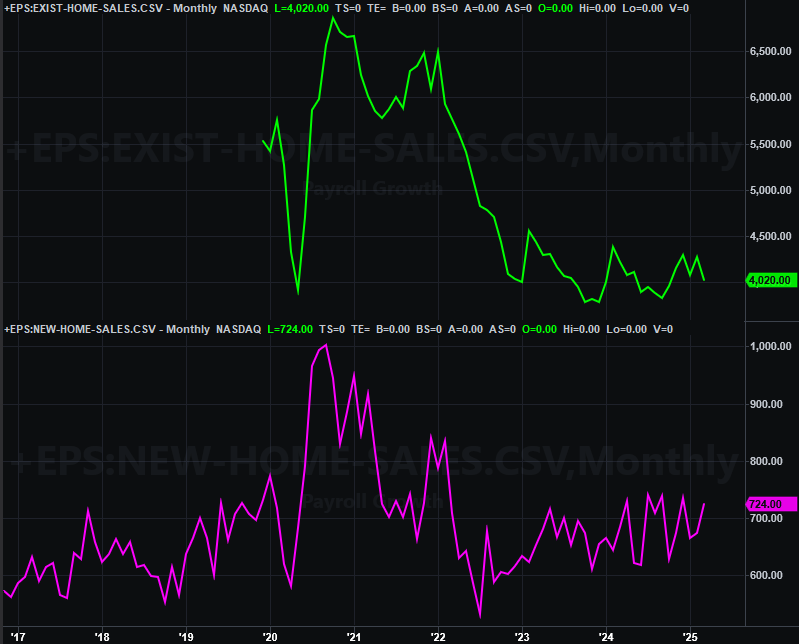
Source: National Assn. of Realtors, Census Bureau, TradeStation
We also got the third and final look at the University of Michigan’s consumer sentiment for April on Friday of last week. Although not (yet) shown on the chart below, it fell to 52.2, almost reaching the low level seen at the very height of 2022’s bear market.
Consumer Sentiment Charts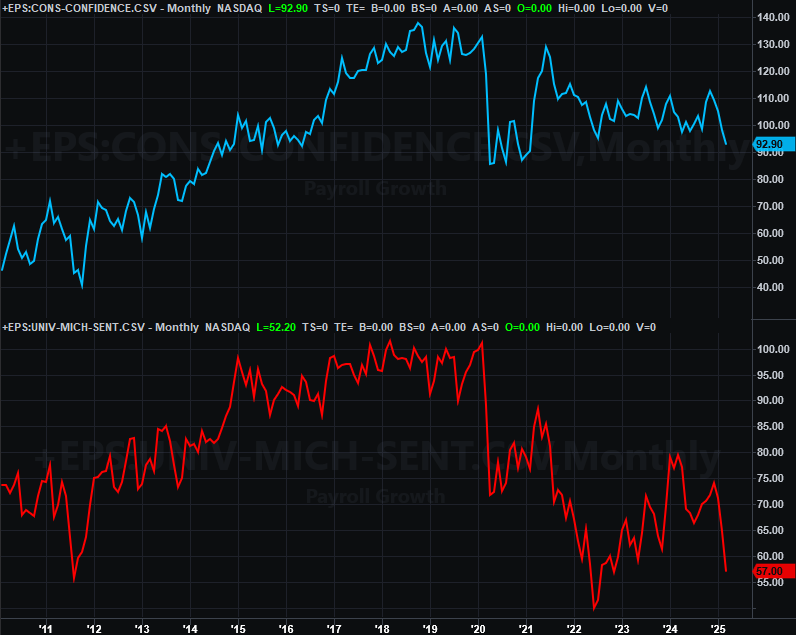
Source: Conference Board, University of Michigan, TradeStation
This is a mixed message, of course. On the one hand pessimism is bearish. On the other hand, consumers are so pessimistic here that pessimism may be peaking, which is often seen at major market bottoms. The only problem with the prospect is the fact that the market’s not at a major low right. Just bear in mind that the stock market isn’t necessarily always tethered to the economy, and vice versa.
Hopefully this coming Tuesday’s look at the Conference Board’s measure of consumer confidence will help us get a better handle on what consumers are actually thinking and feeling here. We’ll see.
Everything else is on the grid.
Economic Data Report Calendar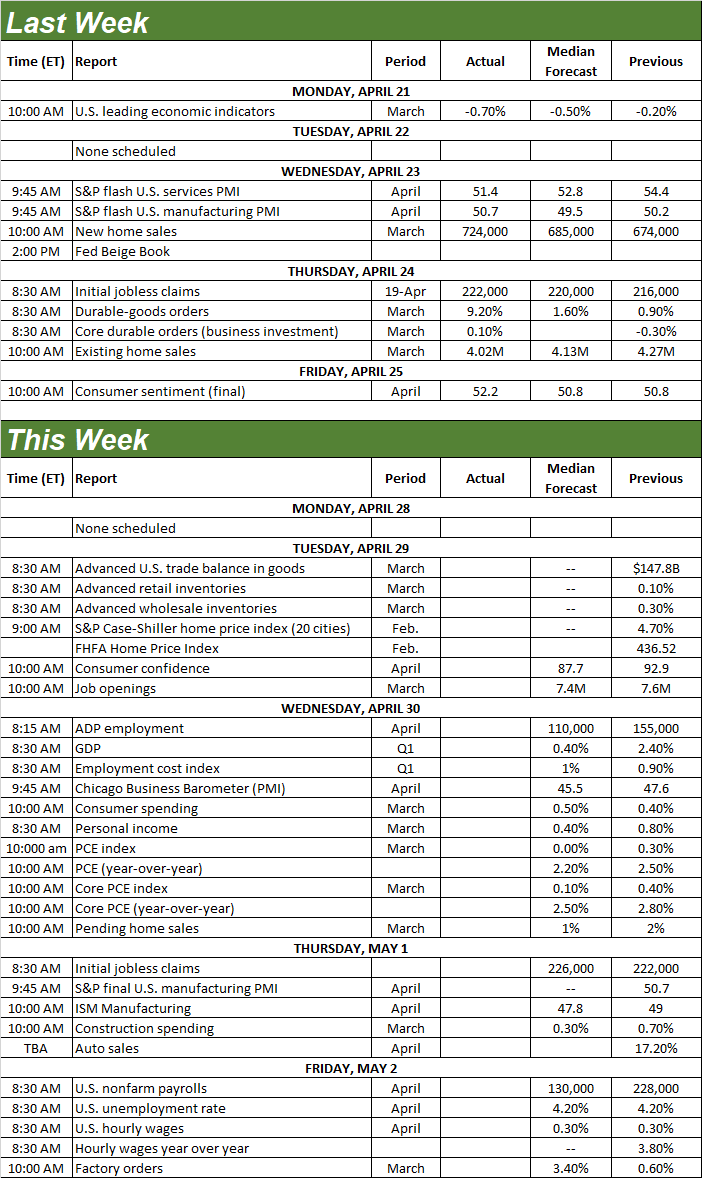
Source: Briefing.com, TradeStation
April’s consumer confidence number from the Conference Board isn’t the only important data scheduled for Tuesday, however. We’ll also round out this month’s look at the real estate market with a price update. The Case-Shilled Index as well as the FHFA Home Price Index for February will be posted that day as well. They’ve both been surprisingly strong despite the backdrop, although the Case-Shiller Index has been cooling off a bit.
Home Price Index Charts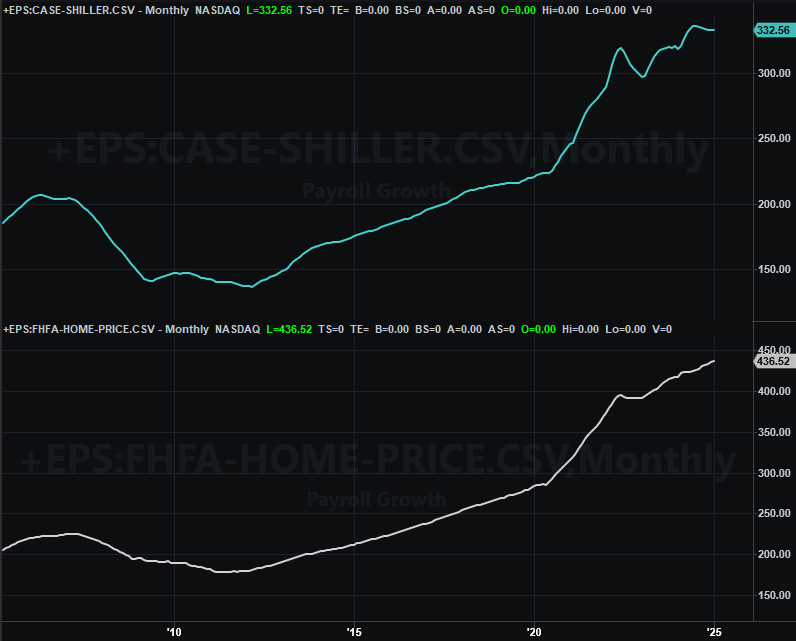
Source: FHFA, Standard & Poor’s, TradeStation
Just remember this information only looks prices of homes that were sold, without considering how many have been sold. And again, sales remain relatively low.
On Wednesday we’ll hear about March’s personal income and personal expenditures, which the Federal Reserve watches very closely when making interest rate decisions. Both should roll in relatively stable compared to February’s data, which was nominal, giving the Fed at least a little bit of time and breathing room. Then on Thursday we’ll hear the ISM’s manufacturing. We’ll talk more about that then, when we preview the ISM’s service index data due the week after this one.
This week’s big news is of course Friday’s jobs report. Things here have been… just ok. The unemployment rate has been edging a little higher, but payroll growth has been reasonably steady with the actual unemployment rate holding at fairly healthy levels. Look for numbers that are more or less the same this time around.
Unemployment Rate, Payroll Growth Charts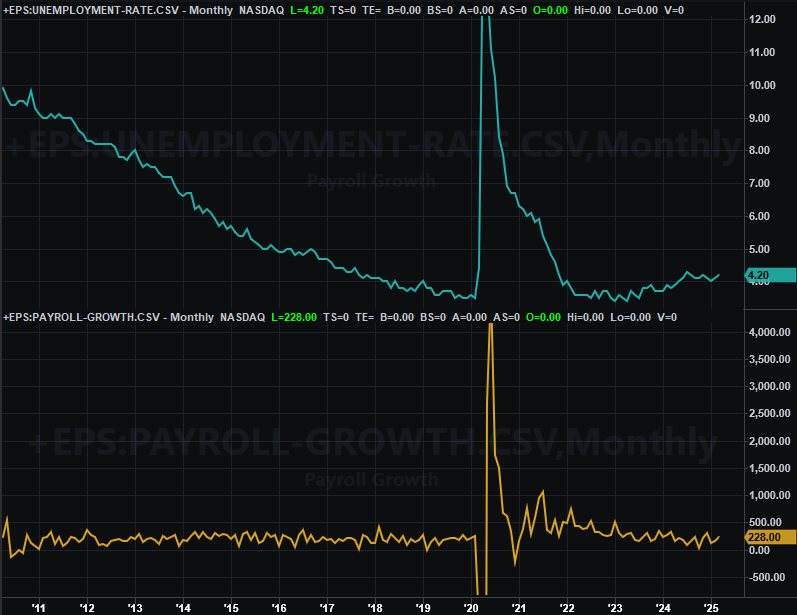
Source: Bureau of Labor Statistics, TradeStation
Stock Market Index Analysis
No fanfare needed this week. Let’s get straight to the point. Take a look at the weekly chart of the S&P 500 below. After a slight lull the week before, the market rekindled its reversal rally from three weeks back to fight its way to its best weekly close in the past four weeks. This appears to cement the reversal effort in place, forming a clear “V” shape. The only problem? Even with the 4.2% gain it’s not like the S&P 500 has actually moved back above any major technical ceilings that suggest the bigger-picture paradigm has turned completely bullish.
S&P 500 Weekly Chart, with VIX and MACD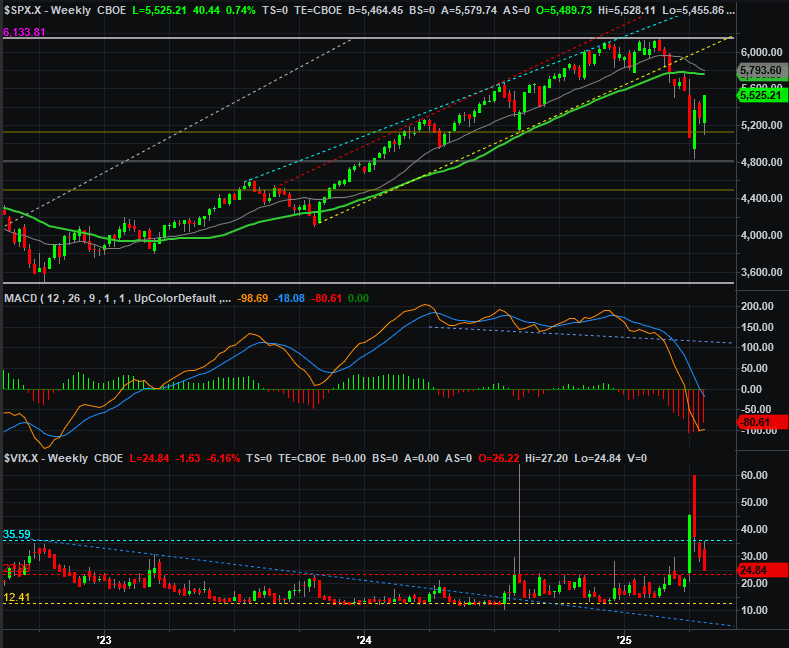
Source: TradeNavigator
That’s not to say it can’t, nor is it to say it won’t. If nothing else, the index is at least moving in the right direction. The volatility index (VIX) is as well, with room to keep falling …. allowing the S&P 500 to keep rising. The S&P 500 could keep rising another 235 points, however, and still not hurdle the 200-day moving average line (green) at 5,760 that would signal a major shift back into bullish mode. And, given the sheer severity of February’s and March’s pullback, the argument that this is only a temporary dead-cat bounce holds enough water.
Here's the daily chart of the S&P 500, which shows us a couple more things… but mostly not-bullish things. Although the index did manage to crawl back above its 20-day moving average line (blue) at 5,365 -- which is bullish -- it left a gap behind on Wednesday that’s not begging to be closed. And, not only did the index not even get within striking distance of its 200-day line, it’s not even yet testing its 50-day moving average line (purple) at 5,636 following the so-called “death cross” of these two moving average lines (circled in yellow) a couple weeks ago. There’s room for the index to continue rising without making any actual net technical progress.
S&P 500 Daily Chart, with VIX and Volume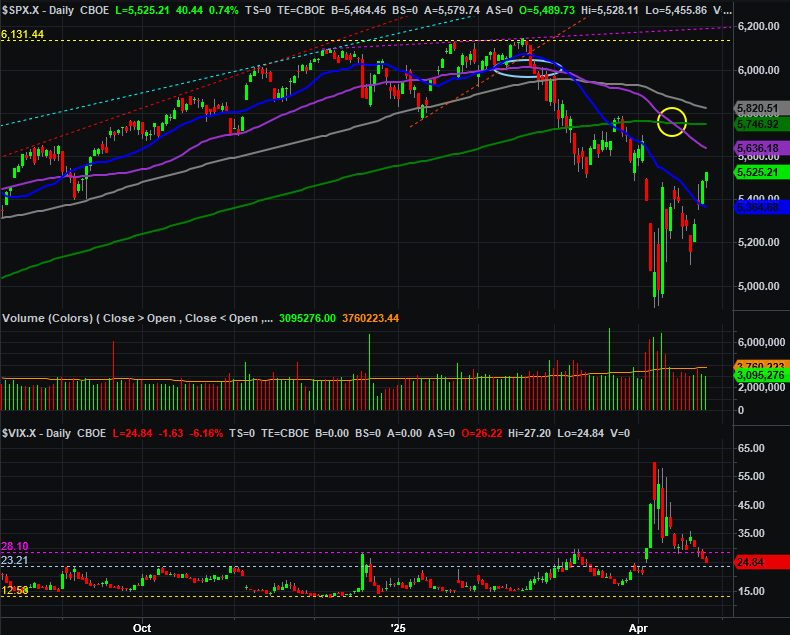
Source: TradeNavigator
The daily chart shows us another red flag about this rally effort as well. That is, although it made tremendous forward progress last week, it did so on below average volume. This move may not be the majority opinion right now.
Here’s the daily chart of the NASDAQ Composite. It shows us pretty much the same thing as the S&P 500’s, reaching a new three-week high that still leaves the index well short of its most of its pivotal moving average lines. And like the S&P 500, the volume behind the NASDAQ’s recent advance in on the anemic side, suggesting there’s not actually a great deal of backing behind this rally.
NASDAQ Composite Daily Chart, with VXN and Volume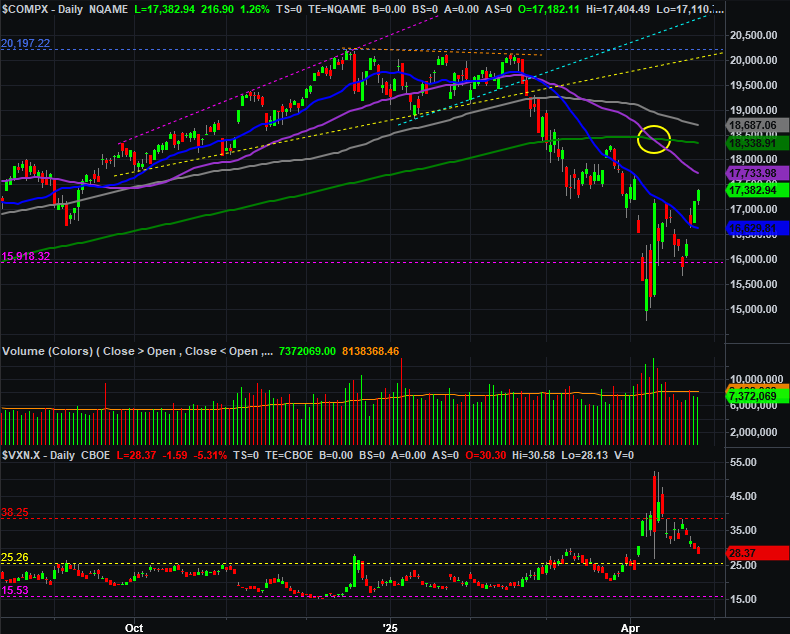
Source: TradeNavigator
Here’s the weekly chart of the NASDAQ Composite for a bit more perspective. This viewpoint shows us just how big and quick the selloff from February’s peak was. This graphic also shows us that even with the big rally over the course of the past three weeks, the index is still far from being back into the rising bullish channel that had been steering it higher since early 2023.
NASDAQ Composite Weekly Chart, with VXN and MACD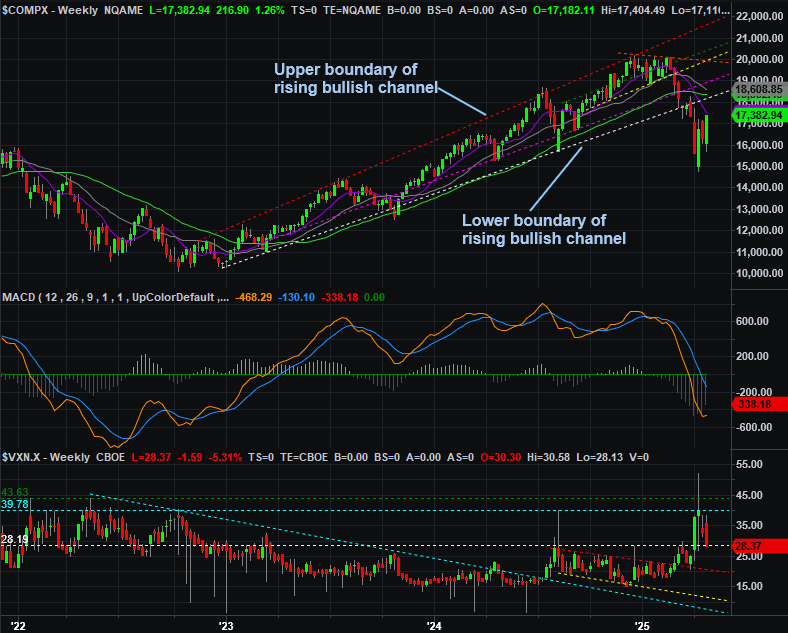
Source: TradeNavigator
That being said, we’re also keeping close tabs on the NASDAQ’s volatility index (VXN). Like the S&P 500’s VIX, it appears to have peaked, yet also still has enough room to continue edging lower for a while. That means the market has some opportunity to keep working its way back above at least most of its important technical support… like its longer-term moving average lines.
So what’s the call? The smart-money move right now may be doing nothing at all, and letting this indecision run its full course while the market’s looking for a more discernible (and longer-lived) footing. There’s certainly not enough certainty in buying into last week’s bullishness just yet.