Weekly Market Outlook - Sellers Are Ready to Take a Break, But Not Throw In the Towel

A strong showing on Friday salvaged what would have otherwise been another losing week. But, is it enough to stop and reverse the bigger meltdown that took shape beginning this month? It's too soon to say. The market's certainly primed for some degree of bounce here, even if only a temporary one. It remains to be seen if there's not more downside to go before reaching bottom though. As rough as the past four weeks have been, there's still lots of froth following incredible rallies from 2020 and 2021.
We'll look at the reversal effort in detail below, as we always do. First, however, let's recap last week's economic reports and preview what's in the cards for this week. There's a biggie coming on Friday... January's jobs report. It could make or break the market if stocks are still as fragile then as they are now.
Economic Data Analysis
Unsurprisingly, home prices continue to rise. What is surprising is how home values continue to rise at their meteoric rate, driving well into record-high territory in each of the past 16 months. Both the Case-Shiller Index and the FHFA Home Price Index improved by double digits (year over year) in November.
Home Price Charts
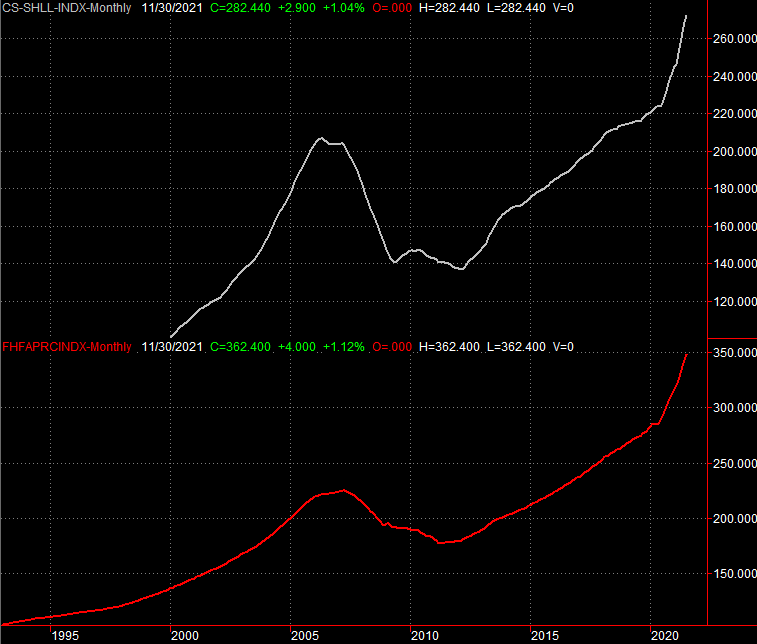
Source: Case-Shiller, Standard & Poor's, FHFA, TradeStation
Much could have happened -- and probably did happen -- in the two months between then and now. The residential real estate market still seems to be going pretty strong though, even as rising interest rates dampen mortgage applications. December's sales of new homes rose sharply to an annualized pace of 811,000, for instance... a multi-month high that helps offset the disappointing sales of existing homes for the same month.
New and Existing Home Sales Charts
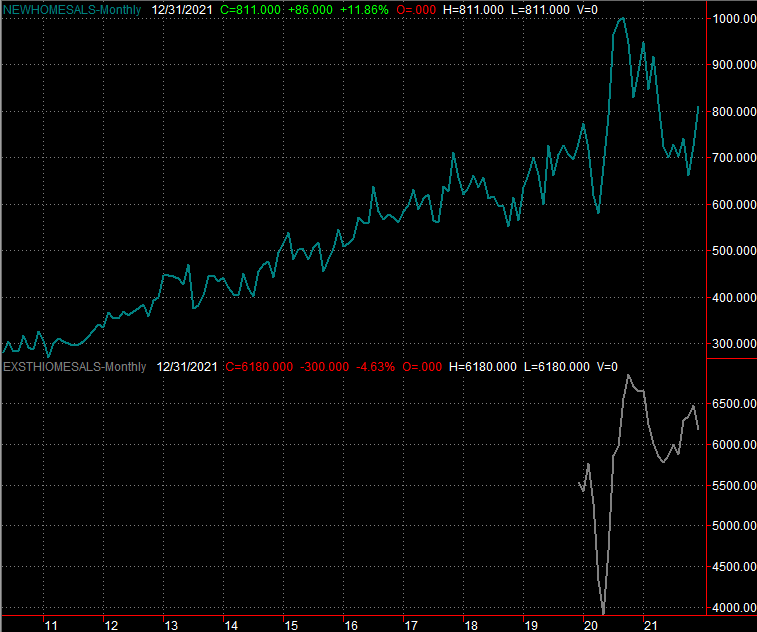
Source: Census Bureau, National Board of Realtors, TradeStation
As a reminder, December's housing starts and building permits were very firm. On balance, the real estate picture appears to remain healthy, unless something drastic has happened in just the past few days (which is a distinct possibility).
In this vein, the only other data of interest posted last week does loosely imply that something may well have happened -- for the worse -- in just those past few days. Namely, consumer sentiment continues to unravel. The Conference Board's consumer confidence figure fell a little from December's level January's reading of 113.8. And, the University of Michigan Sentiment Index moved to multi-year lows of 67.2; the University of Michigan's sentiment measure is more sensitive to inflation, which has been rampant of late.
Consumer Sentiment Charts
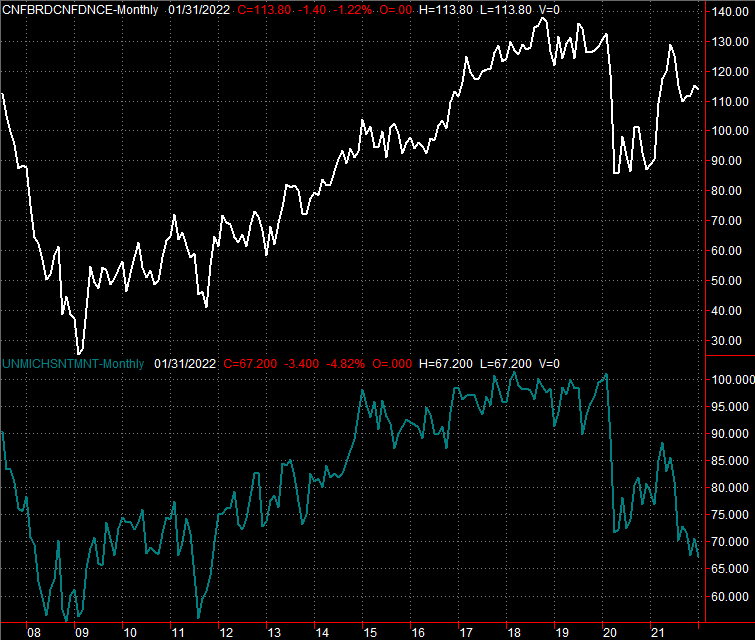
Source: University of Michigan, Conference Board, TradeStation
Although we're not charting it, other big news from last week is the Fed's decision to not raise interest rates this month, and the initial Q4 GDP growth estimate came in at 6.9%, easily topping estimates of 5.6%.
Everything else is on the grid.
Economic Calendar
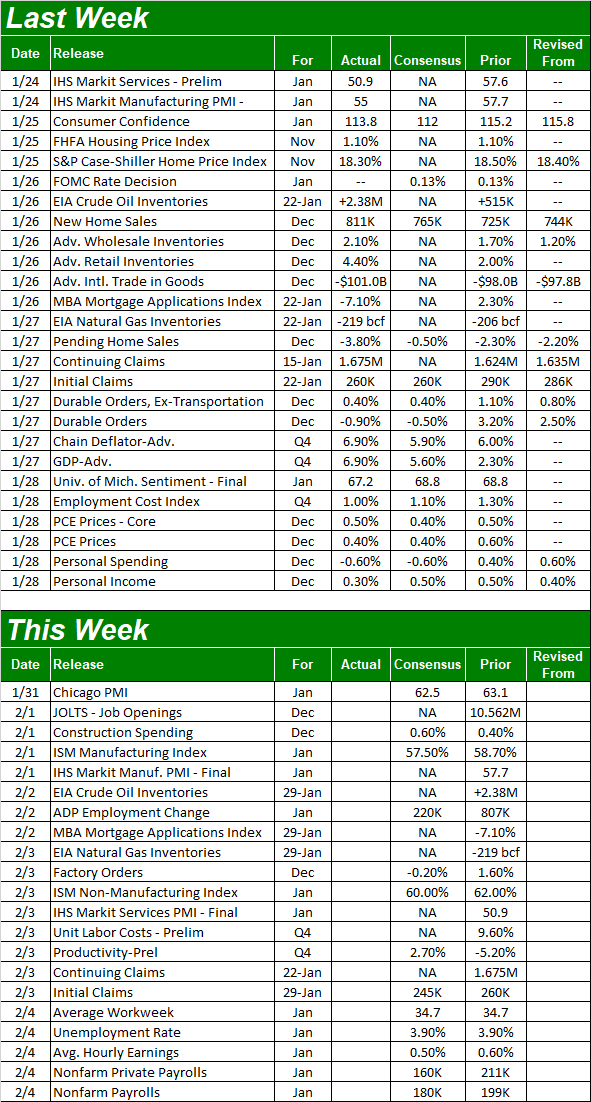
Source: Briefing.com
This week's dance card is pretty full as well, though there's only two data sets we're really interested in.
The first of these data sets is January's ISM services and manufacturing indices. The Institute of Supply Management says the country's factories were a little less busy in January than they were in December, but still busy enough to imply net economic growth. Ditto for the services sector.
ISM Index Charts

Source: Institute of Supply Management, TradeStation
This week's big Kahuna of course is January's jobs report, due on Friday. Forecasters aren't calling for any change to the unemployment rate, modeling a mere 180,000 new payrolls. Just bear in mind December was a blowout month on the jobs front, so the comparison isn't exactly fair.
Payroll Growth and Unemployment Rate Charts
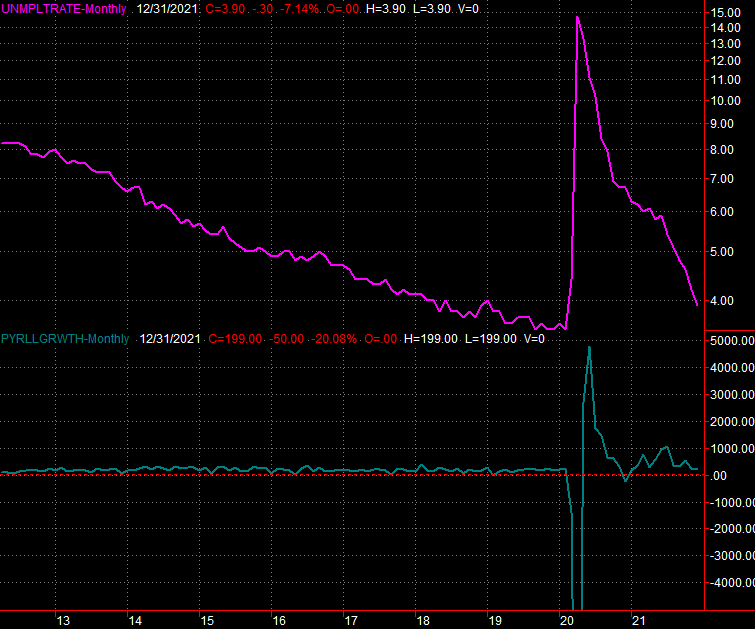
Source: Department of Labor, TradeStation
Stock Market Index Analysis
A lousy week for the market was made a little less lousy thanks to Friday's gain. In fact, the S&P 500's 2.4% rally on Friday led the index out of the red and to a gain of nearly 0.87% for the five-day stretch.
The move didn't, however, actually get the S&P 500 out of technical trouble.
Take a look at the daily chart of the index below. Friday's strength carried the index to a gain, but didn't carry it back above the pivotal 200-day moving average line (green) at 4433. This line needs to be hurdled before we can take any recovery attempt to seriously. The modest volume behind Friday's advance also says there's not a great deal of conviction behind the move... at least not enough given the current situation. (And, even then, a move above the 200-day moving average line might not be enough. There's a massive amount of technical resistance forming around 4580, where several other moving average lines are converging.)
S&P 500 Daily Chart, with VIX and Volume
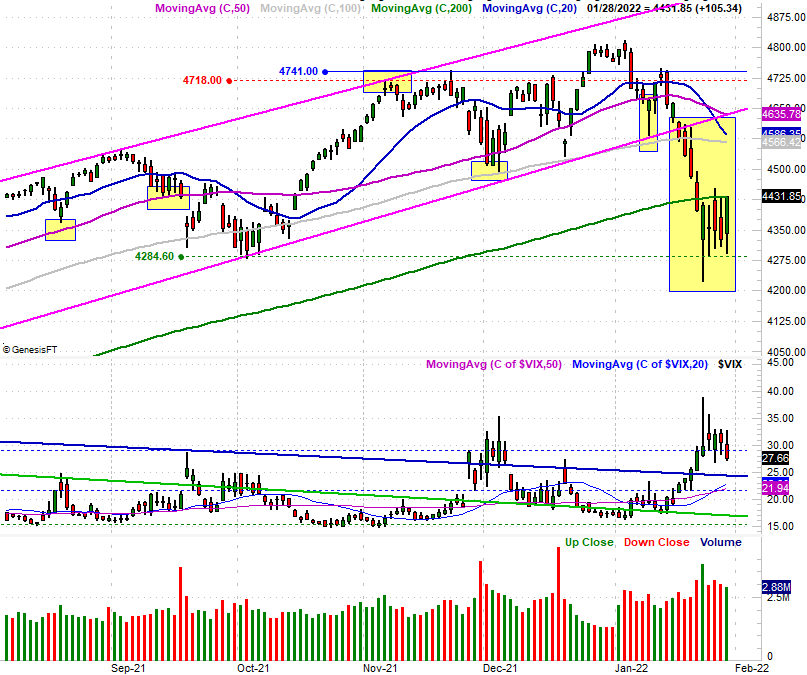
Source: TradeNavigator
The daily chart of the NASDAQ Composite looks similar, though not identical. Namely, the composite bounced sharply on Friday. That wasn't enough, however, to keep the NASDAQ out of the red for the week, nor get it back above its 200-day moving average line (green) at 14,720.
NASDAQ Composite Daily Chart, with VXN
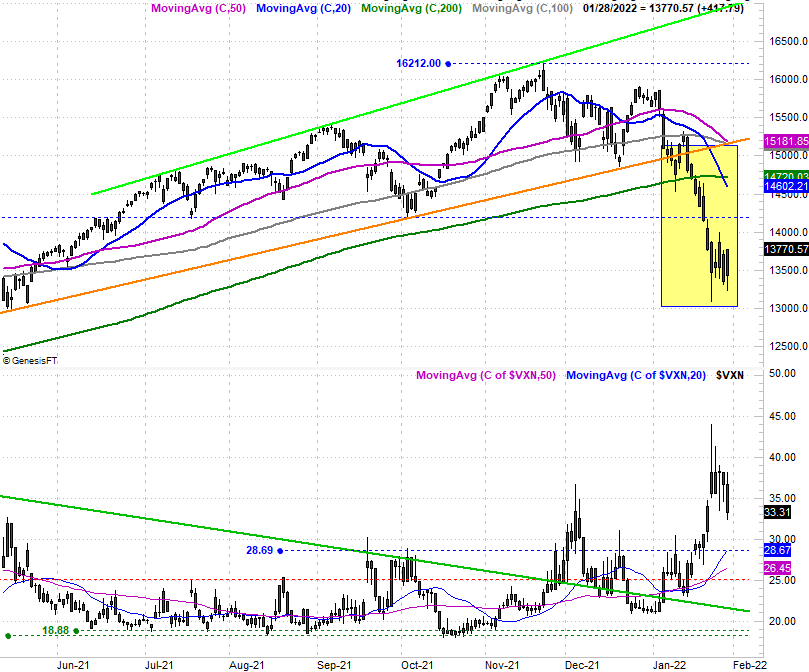
Source: TradeNavigator
This sets the stage for a rebound move that end up not actually meaning much... a dead-cat bounce that doesn't produce any real follow-through.
The weekly chart of the NASDAQ Composite put this prospect into better focus. From this vantage point we can see just how far the composite fell between its early January peak and last week's low. All told, the NASDAQ has swung more than 17% during this four-week period, which is more than enough to act as a full-blown correction that proverbially cleans the slate and hits the markets reset button.
NASDAQ Composite Weekly Chart, with VXN
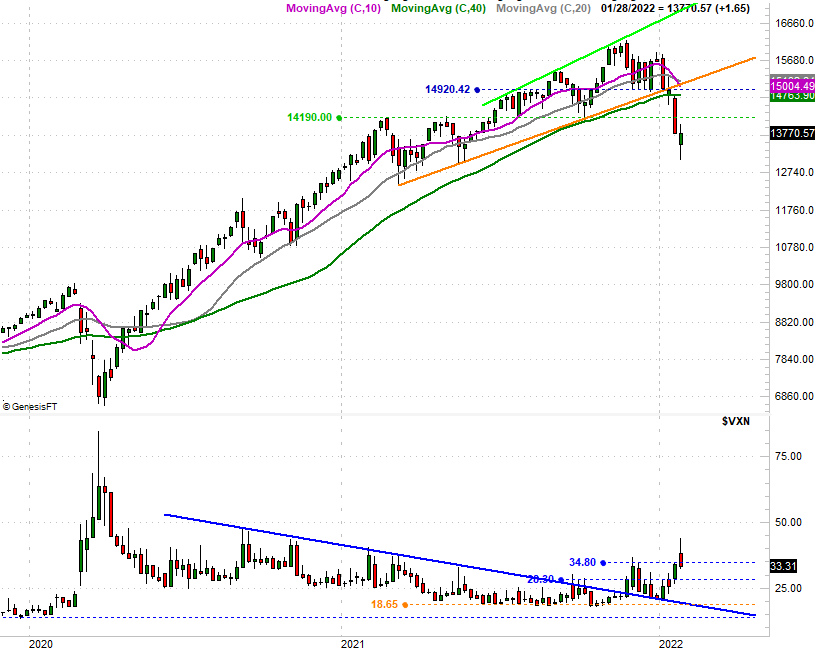
Source: TradeNavigator
The NASDAQ's Volatility Index, or VXN also hints that last week is also likely to end up serving as something of a pivot point. The VXN touched a multi-month high before peeling waaayyyy back. This intraweek reversal bar loosely says sentiment has swung from doubt to at least some optimism, even if it's a speculative optimism.
The weekly chart of the S&P 500 tells a similar story, but perhaps makes an even better case for at least a near-term bounce. Notice on the chart below that the index reversed out of downtrend into bullish mode just by brushing the technical floor around 4270, where the index bottomed in October, and sort of found support in July after meeting resistance around there in the first half of last year. In a similar sense, the S&P 500's Volatility Index (or VIX) firmly reversed course once it bumped into its own technical ceiling around 38, where it's peaked several times since the middle of 2020.
S&P 500 Weekly Chart, with VIX and Volume
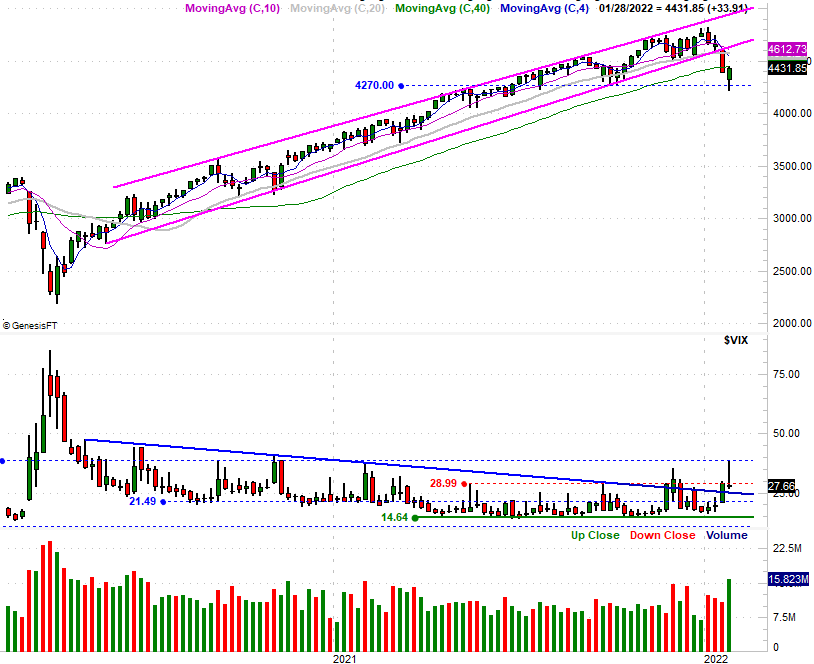
Source: TradeNavigator
Let's assume last week's turnaround is going to get a little traction this week. Let's not assume, however, that such a bounce is built to last. Stocks have been severely sold off and are ripe for sympathy buying. There's lots of resistance not too far above where most of the indices are at this time though. That's going to be the real test.