Weekly Market Outlook - Running Out of Room to Rally
Against the odds, stocks logged a win last week... a pretty good one, in fact. The S&P 500 closed 2.7% above its close from the prior Friday, while the NASDAQ Composite ended the five-day stretch with a 3.1% gain. Even the Dow plugged into the rally, with the blue chip index making a weekly gain of 1.9% to end Friday's action at a record high close of 33,800.6.
Still, there are some problems. All three indices left behind gaps thanks to Monday's strong open, which for two of the three means there are now two weeks' worth of gaps to backfill. The S&P 500 also bumped into a major technical ceiling, and suspiciously didn't move any higher. And, perhaps most concerning of all, the volume (and now the participation) in the rally leaves MUCH to be desired.
Of course, we were having a similar discussion just a week ago, and it didn't stop the bulls then. So...
We'll drill into the what and where below. First, let's look at last week's big economic announcements and see what's coming this week that could move the market. Spoiler alert: There's a lot that could upset the apple cart beginning with Tuesday's consumer inflation report.
Economic Data Analysis
And if last week's producer inflation figures are any indication, investors should be worried.
The long and short of it is, the bill for all that cheap money that's been printed out over the course of the past year is proverbially coming due. Producer inflation reached an annualized pace of 4.2% last month, and while the core producer inflation figure of 3.1% is a little more palatable, both are as high as they've been in years. Economists don't think consumers will have it quite as bad, but considering how wrong they were about producer inflation rates, the CPI outlook isn't one to blindly trust.
Inflation Rate (Annualized) Charts
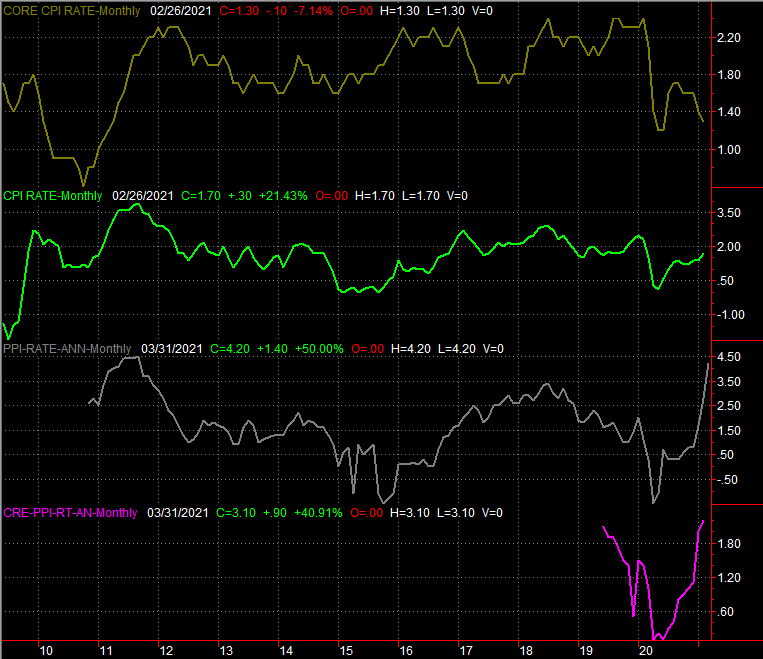
Source: Department of Labor, TradeStation
In their defense, we're at a tricky time. The COVID-19 pandemic moved into the United States in late-February of last year, and by the end of March had completely wrecked any semblance of normalcy. The year-over-year comparison may be misleading. The problem is, producer and consumer inflation have been quietly trending upward for three months now. That's got nothing to do with the timing of the comparison.
The only other noteworthy item from last week is the Institute of Supply Management's services index report. As was the case with is sister report -- the manufacturing index -- we were given a pleasant surprise. The non-manufacturing index easily eclipsed its outlook of 58.5 to reach a record-high reading of 60.4.
ISM Index Charts
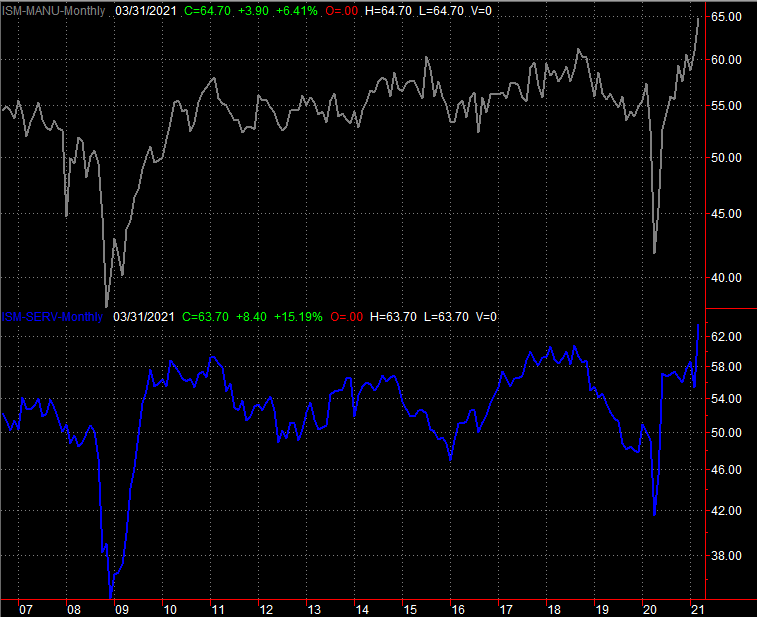
Source: Institute of Supply Management, TradeStation
That's going to be a tough act to follow, as it likely has a lot to do with the sudden restart of the economy; it doesn't reflect normal working conditions. Still, economic activity begets economic activity.
Everything else is on the grid.
Economic Report Calendar
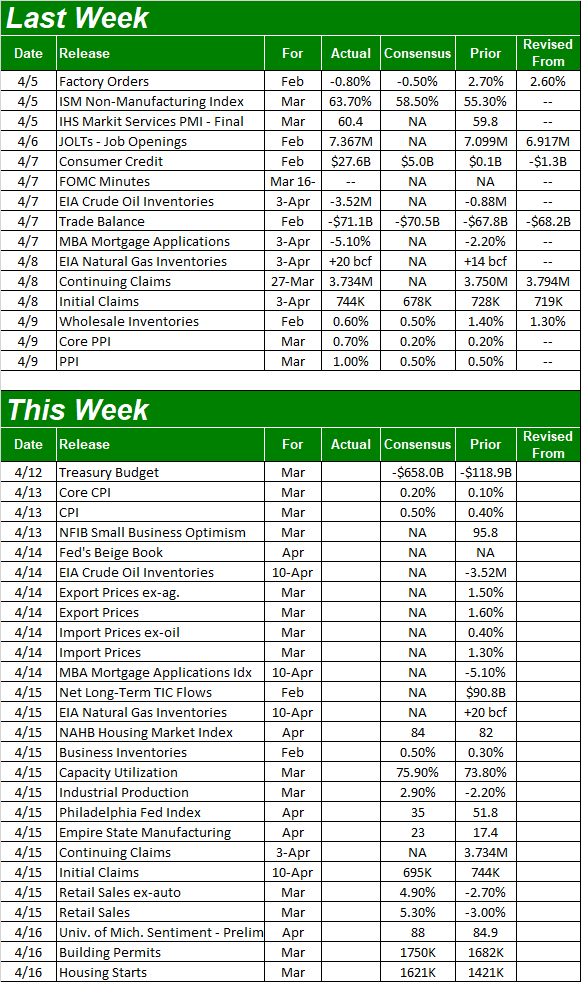
Source: Briefing.com
After Tuesday's consumer inflation report, brace yourself - Thursday could be raucous. In addition to the Fed's capacity utilization and industrial productivity figures, we'll hear about last month's retail spending.
In step with strong ISM figures, economists believe the nation's factories and their total output continued to improve through March. In fact, forecasters predict capacity utilization and industrial productivity will rise to their highest reading since the pandemic took hold.
Capacity Utilization and Industrial Productivity Charts

Source: Federal Reserve, TradeStation
Thursday is a big day too. That's when we'll hear about last month's retail spending, indicating whether or not consumers are truly feeling confident. Economists are calling for explosive growth, but keep in mind that's growth compared to February's surprisingly weak numbers. Nevertheless, spending continues to move into record territory. Consumers are doing their part, emboldened by stimulus checks.
Retail Spending Charts

Source: Census Bureau, TradeStation
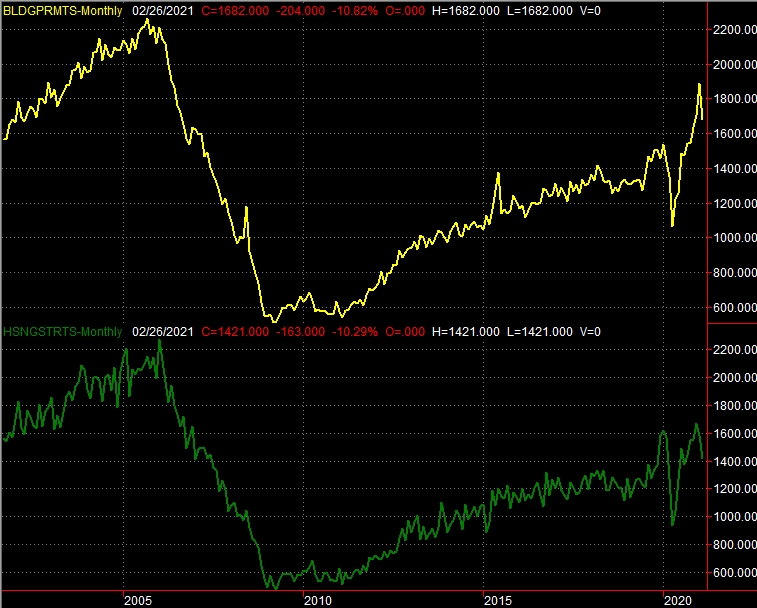
Finally, look for March's housing starts and building permits data on Friday. They should be good. Economists are calling for gains on both fronts, pushing back against a real estate headwind that materialized a couple months back. We need some strength here.
Housing Starts, Building Permits Charts
Source: Census Bureau, TradeStation
Stock Market Index Analysis
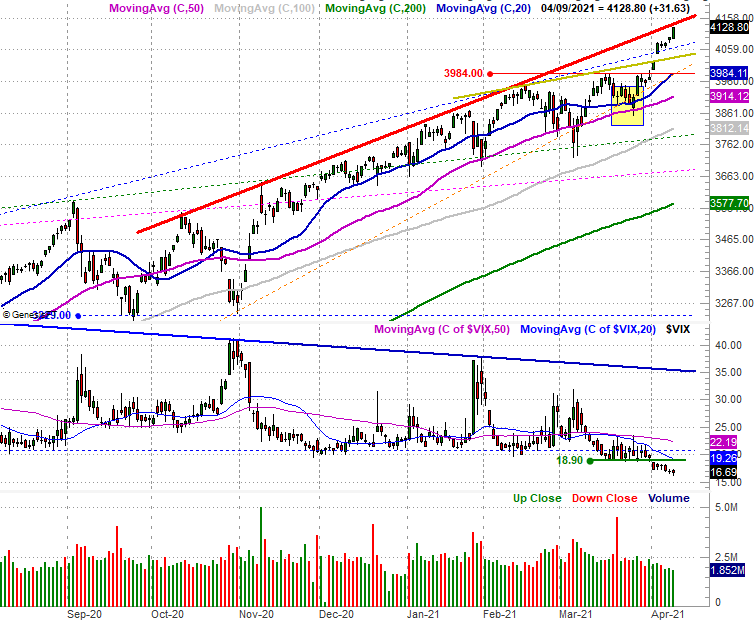
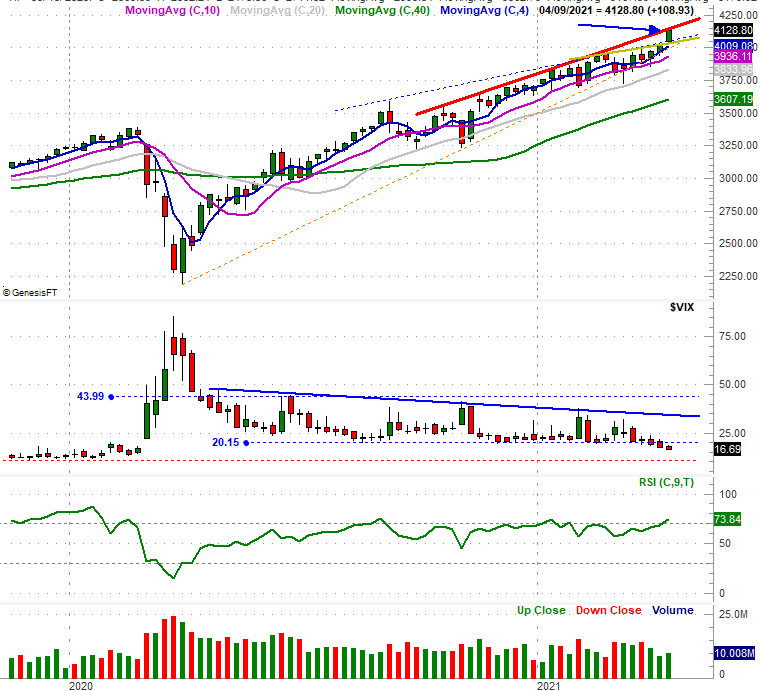
This week starts out with a look at the weekly chart of the S&P 500, as it's here where we can most readily see our biggest concern about the rally's health. Namely, while the renewed momentum is impressive, that momentum only carried the index to a well-established resistance line (red) that connects all the key highs since October. Then there's the not-so-small matter that the market's just plain overbought; the RSI line is back above 70 (if that means anything anymore).
S&P 500 Weekly Chart, with VIX, RSI, and Volume
Source: TradeNavigator
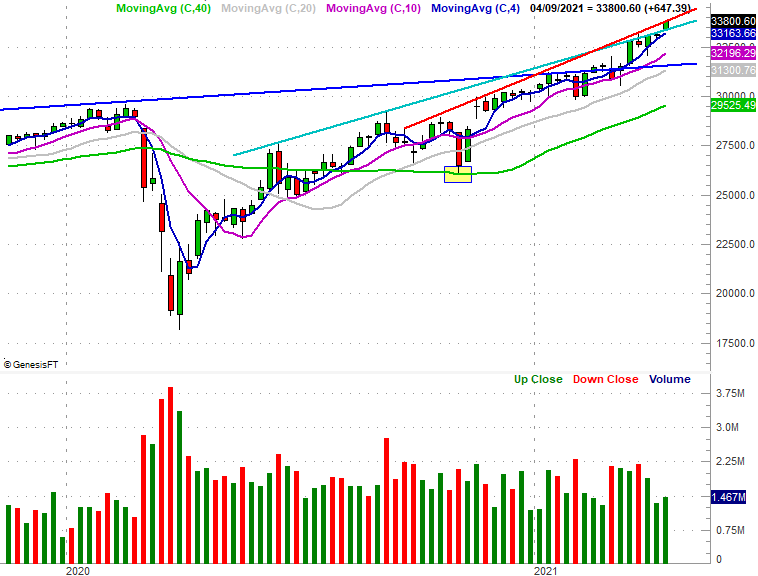
Ditto for the Dow Jones Industrial Average.
Dow Jones Industrial Average Weekly Chart, with Volume
Source: TradeNavigator
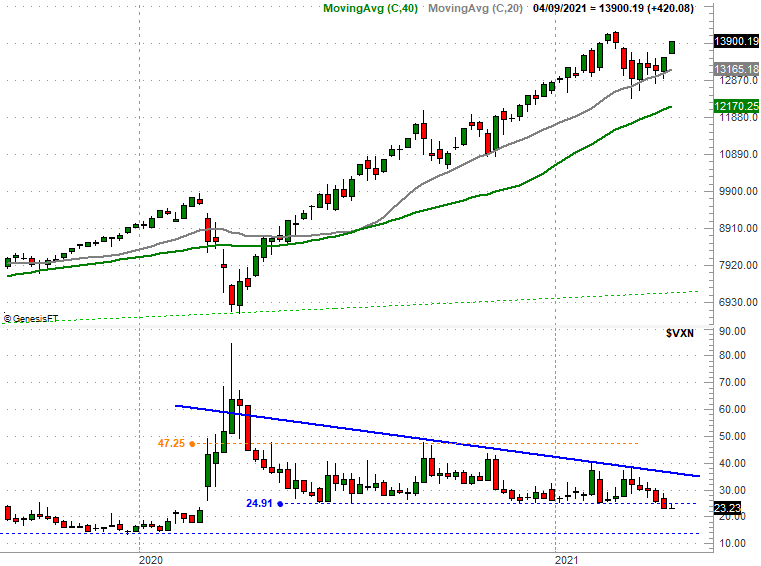
Both of these indices are in contrast with the NASDAQ Composite, which didn't move to record highs last week. It did push up and off of its 100-day moving average line (gray) though, and seemingly still has room to run. The NASDAQ's Volatility Index also has a little room to keep falling... now that it's broken below its floor around 24.9.
NASDAQ Composite Weekly Chart, with VXN
Source: TradeNavigator
There are some key problems with the NASDAQ's rebound rally though. Chief among them is the lack of participation in it.
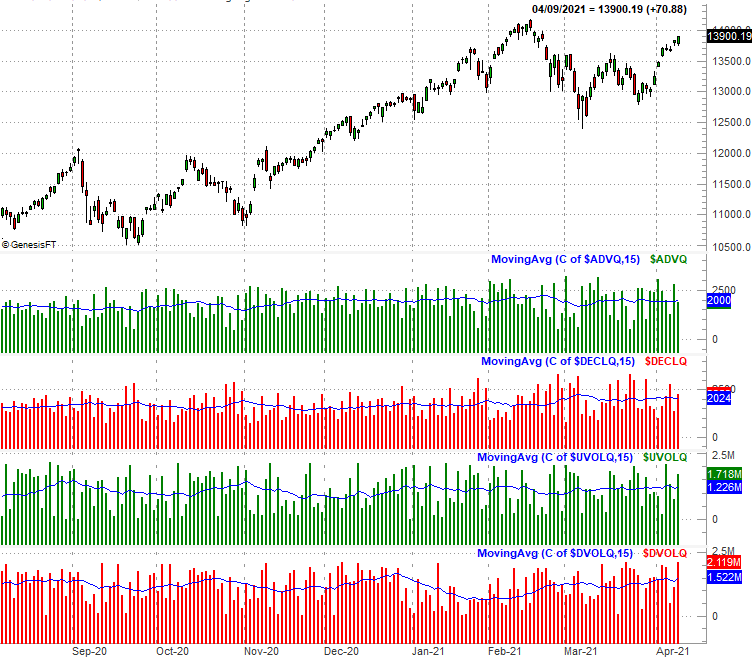
Take a look at the graphic below. The NASDAQ's daily gainers and daily bullish volume aren't getting more bullish. Granted, it's not as of the NASDAQ's daily decliners and the trading volume behind those falling stocks is soaring. It's curious, however, that even with Friday's bullish bump that more of the NASDAQ's stocks fell than gained, and that we saw more bearish volume than bullish volume.
NASDAQ Composite Daily Chart, with Advancers, Declines, Up and Down Volume
Source: TradeNavigator
It's not a new problem... which is a problem in and of itself. We've pointed out several times in recent weeks how only a few big stocks have overcome an otherwise-bearish tide, but those few stocks continue to fight the tide and drag the composite upward. Still though, it's a nuanced that's too risky to ignore.
And for the record, a lack of volume is also a problem for the S&P 500's rally, as measured by its daily volume. Volume has been waning steadily since early March, when the index has been rallying. And it may be near a natural peak anyway. As was noted above, the index bumped into an established ceiling on Friday - a ceiling that connects all the key highs since October. Here's a closer look at it, plotted in red. If the bears were going to make their stand, here's an ideal place to do it.
S&P 500 Daily Chart, with VIX and Volume
Source: TradeNavigator
Given the scenario, one has to plan for a pullback from here. Such a call does "fight the tape," so to speak, counting on a reversal of current momentum rather than betting on the establish trend... the antithesis of momentum trading. From an odds-making perspective though, there are too many things in play that could up-end the market here, and not enough clues to suggest there's room for more upside. Do understand, however, that the bigger-picture rally is far from being broken. For the S&P 500 there's a thick layer of technical support all the way down to the 100-day moving average line (gray) currently at 3812. Recent history also says any pullbacks are to be short-lived.