Weekly Market Outlook - Picking Up (Bearish) Steam

The half-hearted recovery effort that took shape in the early part of last week just wasn't enough. By the time Friday's closing bell rang, the S&P 500 had made a lower low for the week, and a lower high, and for the second consecutive week booked a loss. The index also inched back below a pivotal moving average line, with little in the way of technical support ahead to slow the pullback down.
There is one last bastion of hope, however.
We'll look at what could stave off a meltdown in a moment. First, let's review last week's most important economic news and then preview what's in the pipeline for this week.
Economic Data Analysis
It was a busy week to say the least, particularly in terms of real estate data. But, the easiest approach to getting through all of it is in order of appearance. That means we start with last month's producer inflation figures, rounding out last week's look at January's consumer inflation data. In short, factories, assemblers, and processors are merely passing along their higher costs to individuals. The overall producer inflation rate now/still stands at 9.7%, and on a core (removing gas and food costs) basis the rate is a still-lofty 6.9%.
Inflation Rate (Annualized) Charts
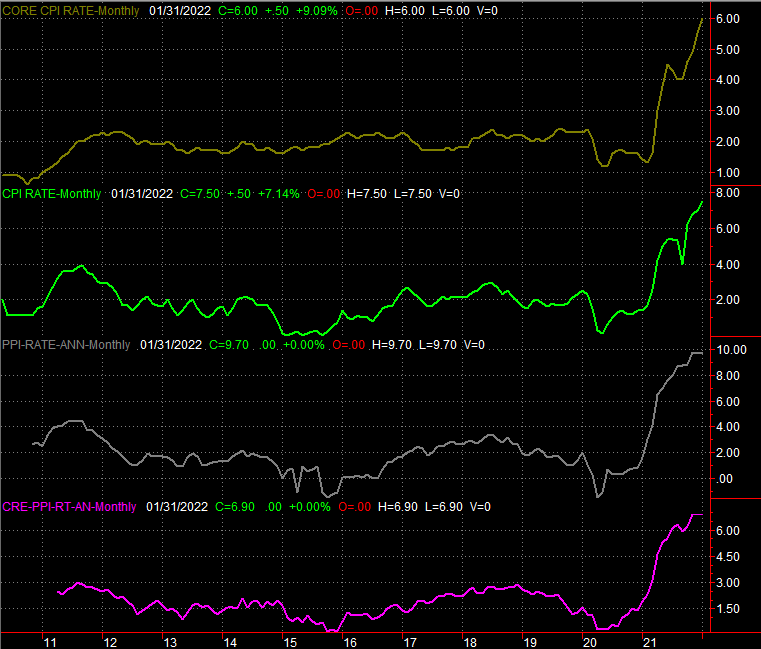
Source: Bureau of Labor Statistics, TradeStation
The prospect of an interest rate hike in March just edged even higher.
The upside of the inflation figures is, at least the country's factories are selling more and more of their higher-priced goods. Capacity utilization grew from December' 76.6% to 77.6%, blowing away expectations of 76.8%. And, actual production output swelled from December's contraction of 0.1% by 1.4%, easily trouncing economists' estimates for a 0.4% increase. Both figures are now above levels seen right before the pandemic took hold.
Capacity Utilization and Industrial Productivity Charts
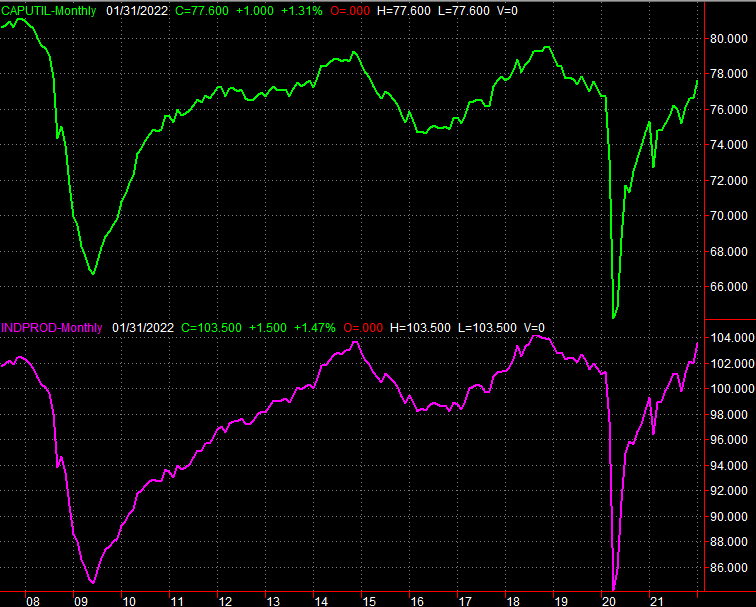
Source: Federal Reserve, TradeStation
Given all of this data so far, it's no surprise to learn retail spending soared last month, up 3.3% not counting automobile sales. Granted, much of the growth can be chalked up to simply-higher prices and a bounceback from December's (calculated annualized) contraction of 2.8%. Nevertheless, at least part of the uptick stems from the fact that wages are firm and consumers are bored. Total spending hit a new outright record level as of last month's data.
Retail Sales Charts
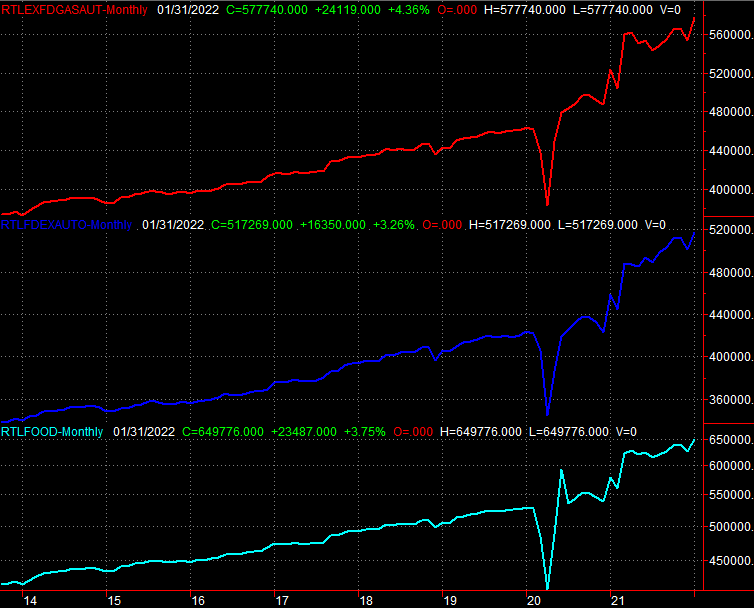
Source: Census Bureau, TradeStation
The real estate data didn't show up until late in the week, but we got a huge helping of it.
The first of these numbers was Thursday's tally of January's housing starts and the number of building permits issued. The former fell from a pace of just over 1.7 million to around 1.64 million, while the latter grew slightly from December's clip of nearly 1.9 million. In both cases though, the bigger trend remains healthy enough.
Housing Starts and Building Permits Charts
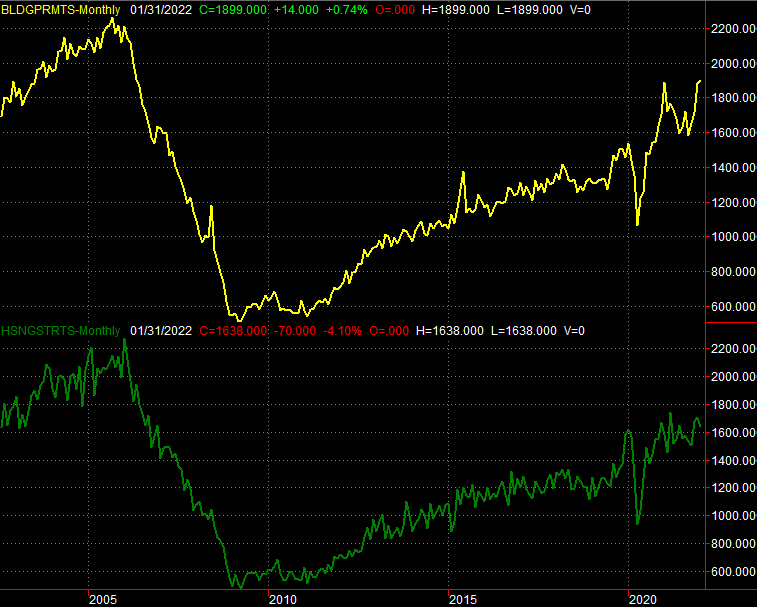
Source: Census Bureau, TradeStation
Finally, we rounded out last week's real estate sales data with the report on sales of existing homes. They ticked higher, from just under 6.1 million to 6.5 million (annualized).
New and Existing Home Sales Charts
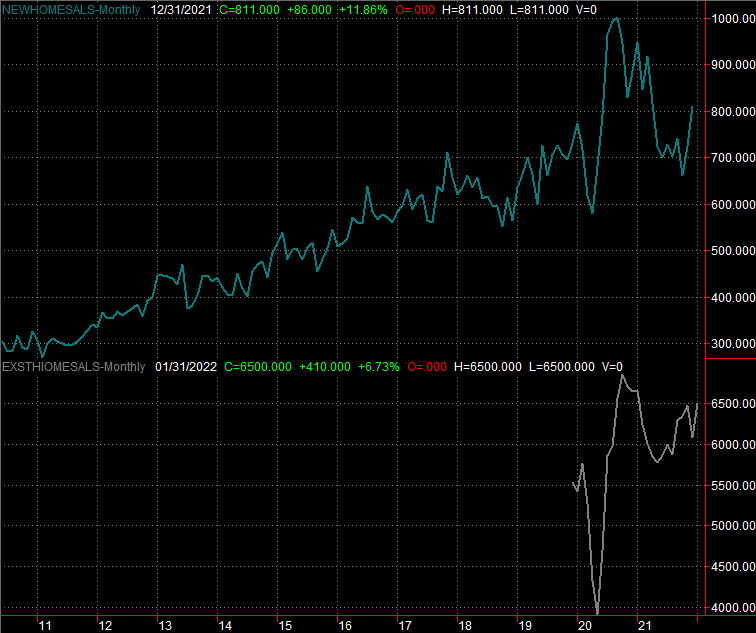
Source: Census Bureau, National Board of Realtors, TradeStation
New home sales for last month will be posted this week, but analysts aren't looking for any growth there. Then again, last month's new home sales were surprisingly strong, given the context.
Everything else is on the grid.
Economic Calendar

Source: Briefing.com
In addition to new home sales, we'll continue to paint the real estate picture this week with Tuesday's look at real estate prices. Both the FHFA Housing Price Index and the S&P Case-Shiller report are due that day, the latter of which is expected to show 18.3% higher (year over year) prices of sold homes.
Home Price Charts
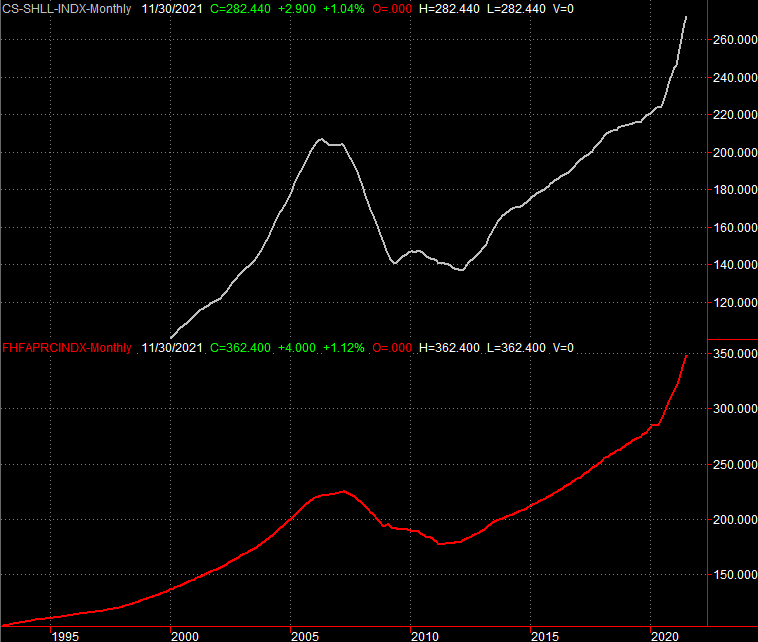
Source: Standard & Poor's, Case-Shiller, TradeStation
The price gains are fun for homeowners and exciting for anyone watching the explosion. In any ways though, this advance seems too strong for its own good, akin to what happened back in 2006.
Finally, it's a big week for consumer sentiment. We'll get the third and final look at the University of Michigan consumer sentiment index for February on Friday, and that follows the release of the Conference Board's consumer confidence figure on Tuesday. Both are expected to fall from January's readings.
Consumer Sentiment Charts
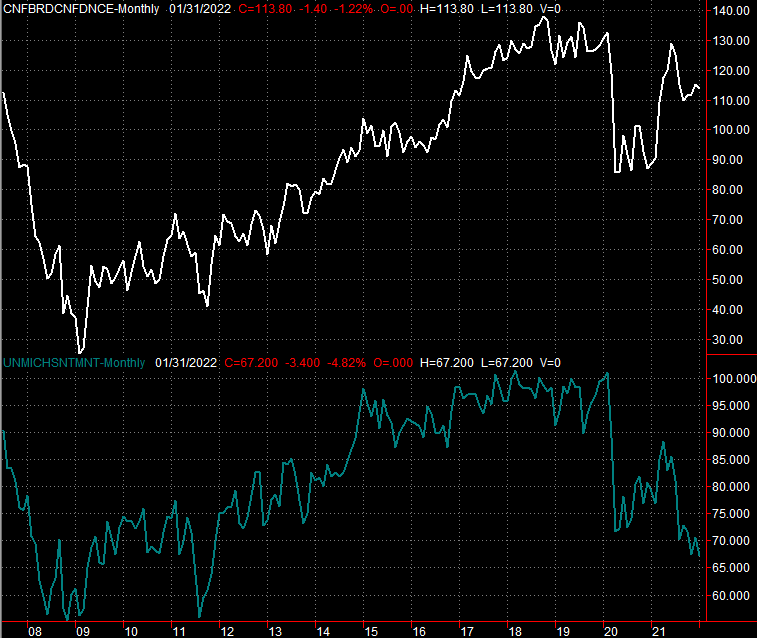
Source: Conference Board, University of Michigan, TradeStation
That seems a bit counterintuitive, in light of all the other mostly-good economic news. There's a two-parted explanation though. First, there's a "do as I say and not a I do" thing going on, where people say they're worried, but aren't actually behaving that way. Second, all o the other economic news above is for January, while the sentiment data due this week is for February. Much has happened in the meantime, although it's worth noting that sentiment has been deteriorating for months now, and that's yet to actually stop the stock market from charging higher. Don't overthink it.
Stock Market Index Analysis
This week's analysis starts with a deep look at the daily chart of the NASDAQ Composite, as this is the most telling of all the charts we normally peruse. Simply put, the composite is falling, and its volatility index (the VXN) is rising. Both have re-established trends in their respective direction as well, and it's going to be tough to stop it now that there's some momentum behind the moves. Underscoring the scope of the problem is the fact that we just saw a so-called "death cross," where the 50-day moving average line (purple) has fallen below the 200-day moving average line (green). This is a hint that the bigger-picture momentum has taken a clear turn for the worst.
NASDAQ Composite Daily Chart, with VXN and Up/Down Volume
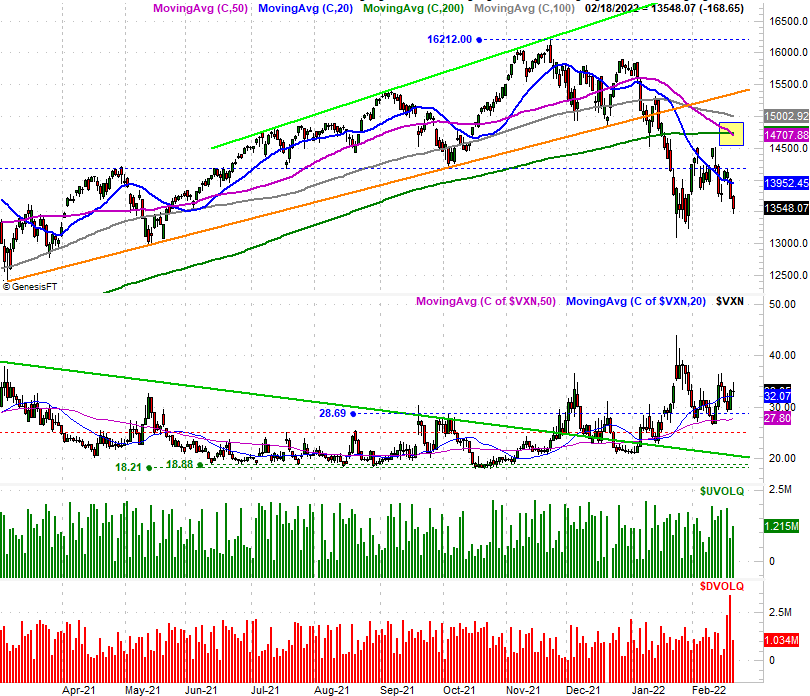
Source: TradeNavigator
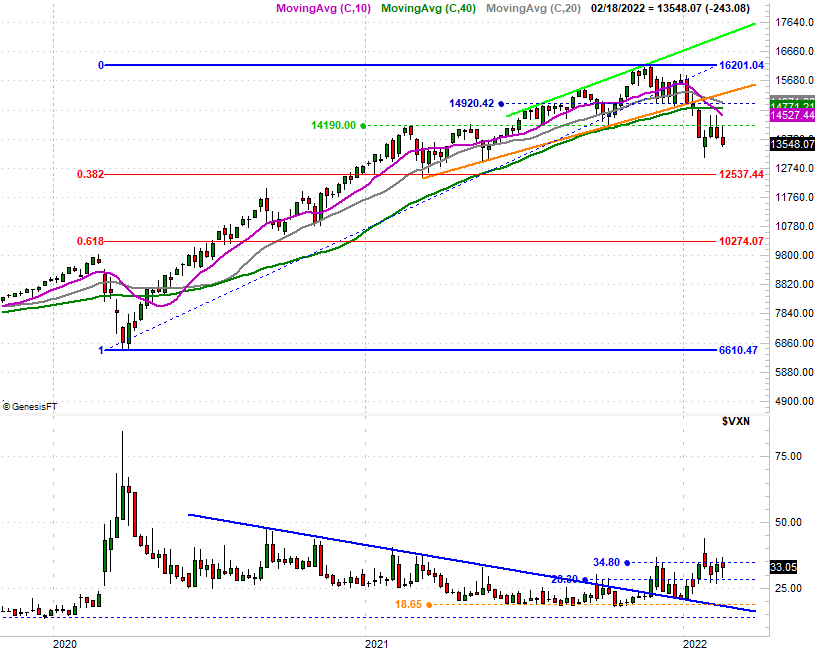
Here's the weekly chart, for a little added perspective. It's in this timeframe we can get a real feel for the shape of the last four weekly bars; it's not good. In each of the last three weeks, Friday's close was well below the high each time, suggesting there's never been any real commitment to what little buying we saw. Mostly though, the weekly view clarifies the strength of the NASDAQ's downtrend and forward "umph" of the NASDAQ Volatility Index. Should the VXN make its way back above the ceiling at 34.8 and the composite itself drifts lower than last week's low of 13,465, there's not a lot that will be able to hold the selling back. In that event, the first (and also the most natural) landing spot is around 12,540, where the index made a major bottom in early 2021, and where the 38.2% Fibonacci retracement line -- a retracement of the rally since the March-2020 low -- currently rests.
NASDAQ Composite Weekly Chart, with VXN and Fibonacci Retracement Lines
Source: TradeNavigator
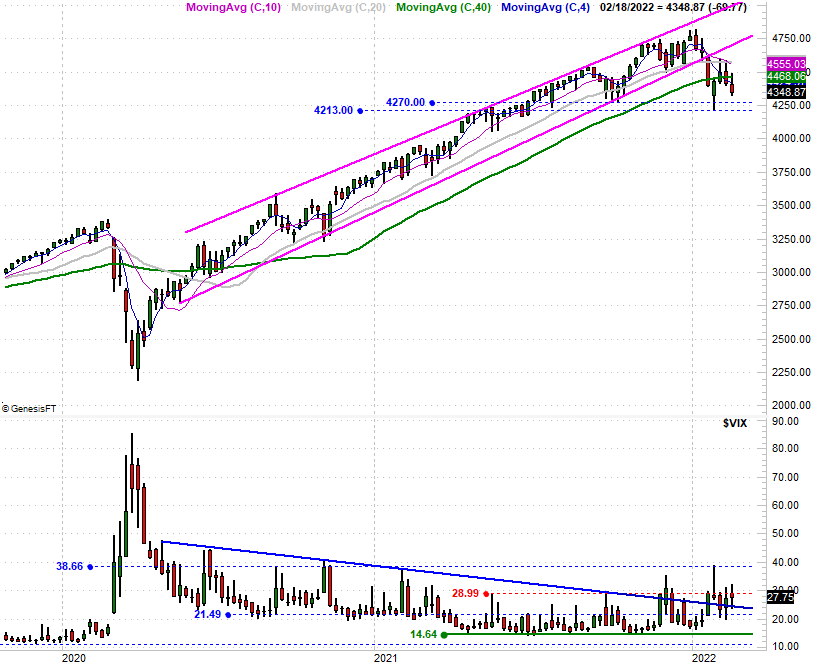
Here's the weekly chart of the S&P 500. We've not yet seen a death cross from this index, but other than that, this chart tells the same story as the NASDAQ's chart... the apparent rebound effort that took shape in late January and early February has already petered out, renewing the downtrend established in January. This chart's also below its 200-day moving average line, and though not with quite as much gusto, the S&P 500's Volatility Index (VIX) looks like it's working on a new uptrend; it's certainly snapped out of its old downtrend.
S&P 500 Weekly Chart, with VIX and Volume
Source: TradeNavigator
Here's the daily chart of the S&P 500, just for good measure. It doesn't tell us a whole lot that we didn't already know. It does tell is, however, that there's firmly more selling volume than buying volume... at least for the NYSE's issues. It's also clear on the daily chart that the S&P 500's big floor right now is 4286, where it made lows a couple of different times since October.
S&P 500 Daily Chart, with VIX and Up/Down Volume
Source: TradeNavigator
Simply put, stocks are on the defensive here. There's still room for the bulls to push back without actually changing their ultimate fate. It would take moves back above all the key moving average lines to reignite the rally we've all enjoyed since the middle of 2020. Stocks had a chance to do that just a couple of weeks back though, and failed to do so. Let's assume the trend will remain intact until it's clear we can no longer afford to do so.