Weekly Market Outlook - One Bad Day Didn't Even Dent the Rally
The market may have ended the week on a somewhat sour note. But, consider the circumstances. The S&P 500 hit a record high on Thursday, as did the NASDAQ Composite. On the other hand, this is the second week in a row the NASDAQ failed to make any net gains, and the S&P 500 isn't faring a whole lot better. It looks like the weight of the huge runup since last March's low is finally becoming a problem, underscored by a few too many earnings red flags.
Nevertheless, all the indices remain above crucial technical support lines.
We'll take a detailed look at what's happening (and what's not happening yet) below. First though, let's paint a bigger picture using the broad brush strokes of last week's big economic data.
Economic Data Analysis
It was a busy week in terms of economic news, with the biggest news being the Fed's (unsurprising) decision to hold interest rates steady by maintaining the target Fed Funds Rate at just above zero. It will remain there until the jobs market is back to its maximum potential and as long as inflation isn't dangerously above its 2% target.
Almost as big - and just as unsurprising - is last quarter's GDP growth of 6.4%. Economists were calling for 6.5% growth, although both are incredible figures. Both are also being compared to horrible year-earlier data.
Bear in mind this is only the first Q1 GDP growth estimates. The number will be revised two more times.
As for chart-worthy information, we got a big dose of sentiment information last week. The Conference Board's measure of consumer confidence jumped to a 13-month high of 121.7. The highest reading before that was last February's 132.6, before COVID-19 was spreading out of control across the country. In a similar vein, the third and final look at April's University of Michigan Consumer Sentiment measure showed a score of 88.3, which was also the best reading since the pandemic fully gripped the country.
Consumer Sentiment Charts
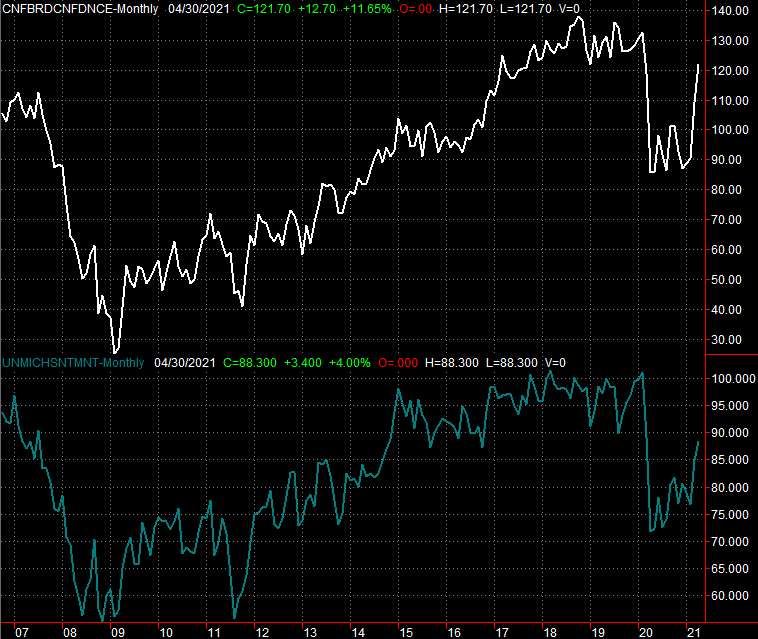
Source: University of Michigan, Conference Board, TradeStation
This strong sentiment is manifesting in other ways, like home prices. They swelled again. Although the data is technically only through February, as of then the Case-Shiller and FHFA Home Price indices are deeper into their pushes into record-high territories.
Case-Shiller, FHFA Housing Price Index Charts
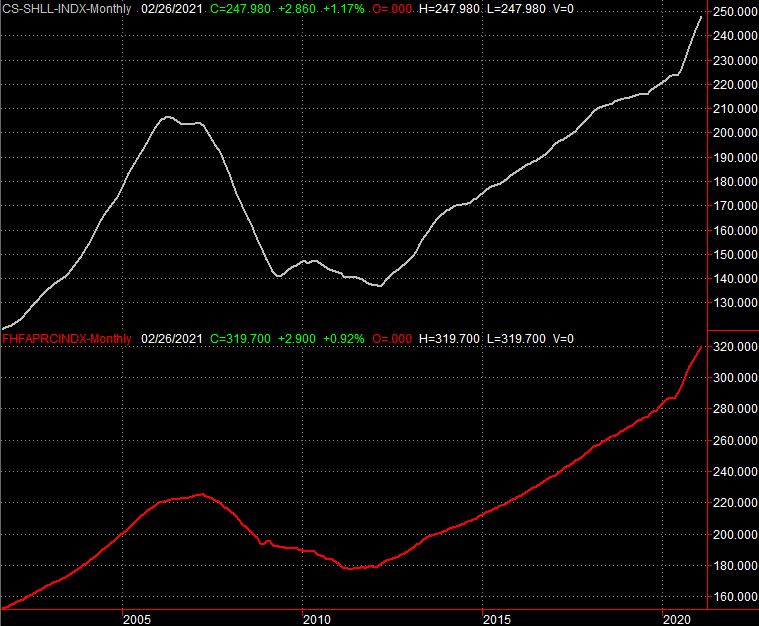
Source: Standard & Poor's, FHFA, TradeStation
Given other real estate data that's been presented in the meantime (like home sales, inventory, permits and starts), there's no reason to think home prices aren't effectively higher now than they were in February.
Everything else is on the grid.
Economic Report Calendar
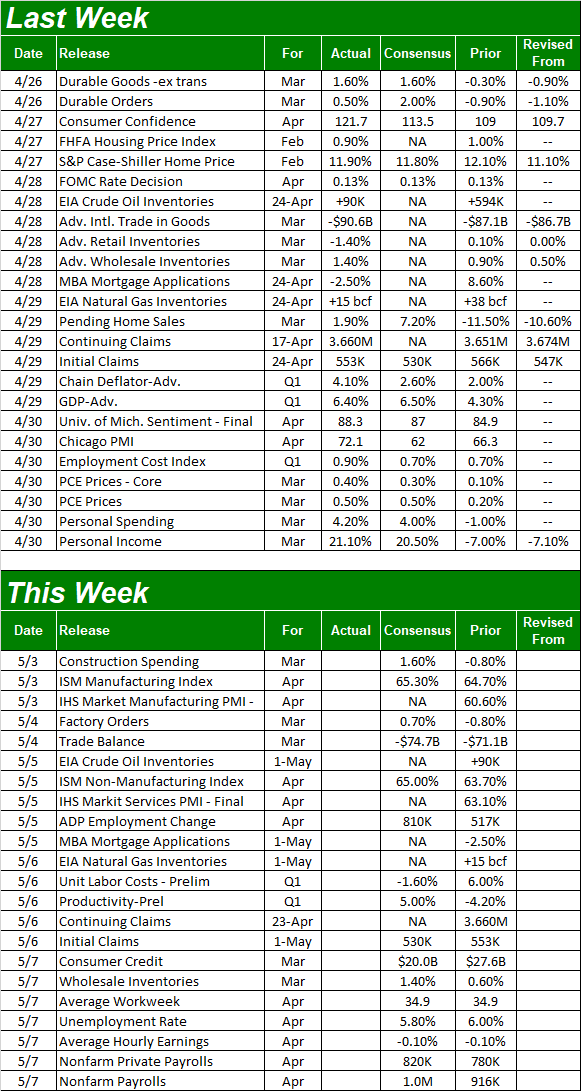
Source: Briefing.com
This week's going to be a busy one as well, although there are only two major announcements we're deeply interested in.
The first of these is the ISM's (Institute of Supply Management) Services Index update due on Wednesday. The figure's been soaring, hitting a record high of 63.7 a month earlier. Yet, analysts believe it's going to inch a little higher for April, hitting 65.0. Anything above 50 is considered good/growing.
ISM Service and Manufacturing Index Charts
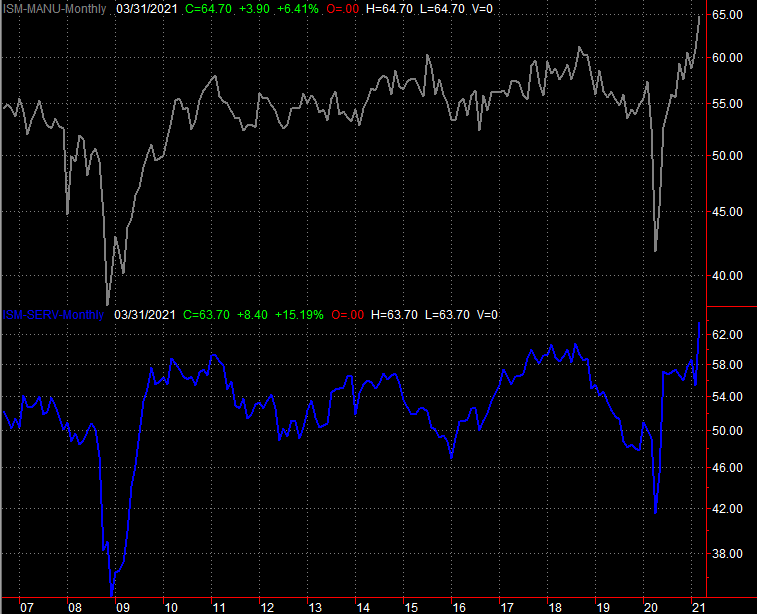
Source: Institute of Supply Management, TradeStation
The manufacturing version of the ISM's indices will be updated next week.
The second set of economic numbers we'll be watching closely this week is Friday's jobs report. We've been making steady progress on this front, and more of the same is projected. The unemployment rate is expected to slide from its current level of 6.0% to 5.8% thanks to the addition of 1.0 million jobs.
Unemployment Rate and Payroll Growth Charts
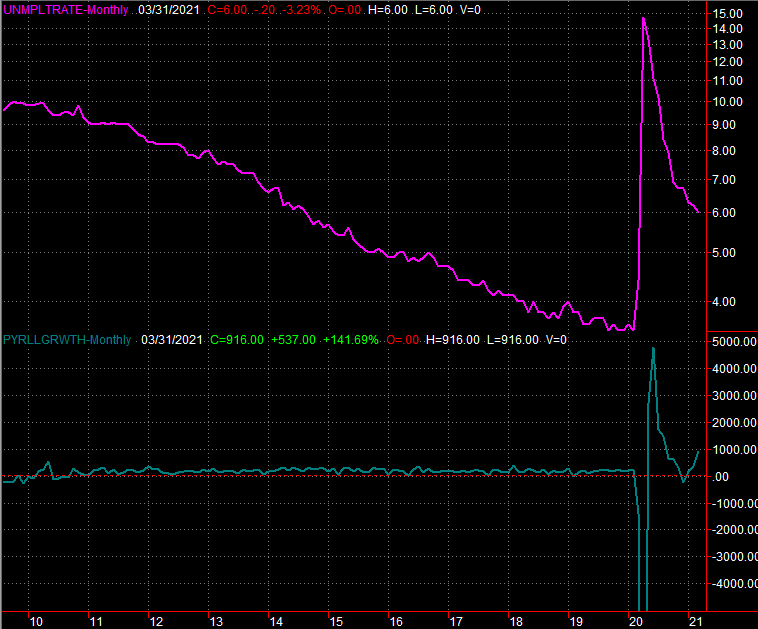
Source: Department of Labor, TradeStation
That's good progress, but as always, consider the circumstances. The unemployment rate itself and employed/unemployed headcounts remain just so-so on an absolute scale, and there's still much to recover in terms of employment.
Stock Market Index Analysis
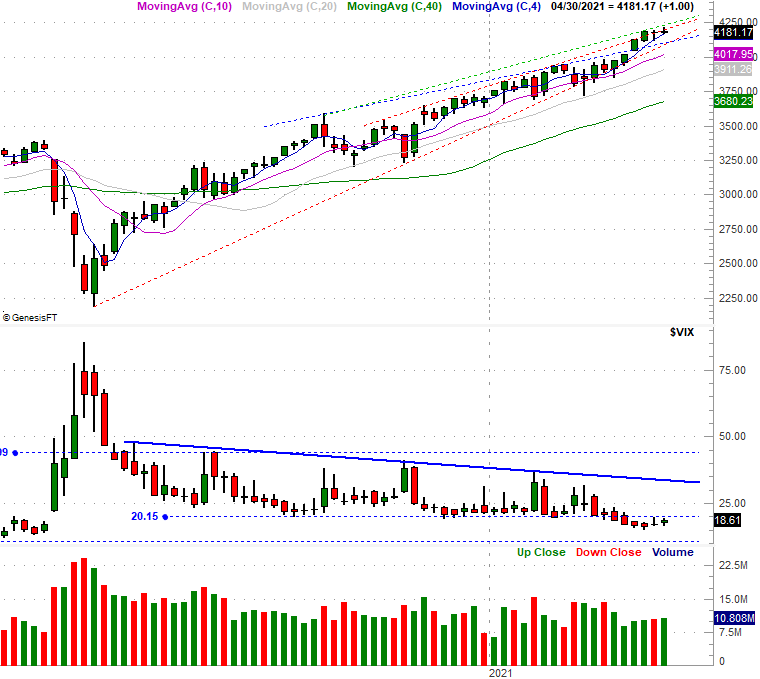
This week's analysis starts with a look at the daily chart of the S&P 500 simply because this shows us the bulk of what we want to know. Namely, the rally is still going strong, and has yet to break under the first of its most critical technical support levels. Those start with the 20-day moving average line (blue) at 4147, but there are several more all the way down to the 200-day moving average line (green) at 3655.
S&P 500 Daily Chart, with VIX
Source: TradeNavigator
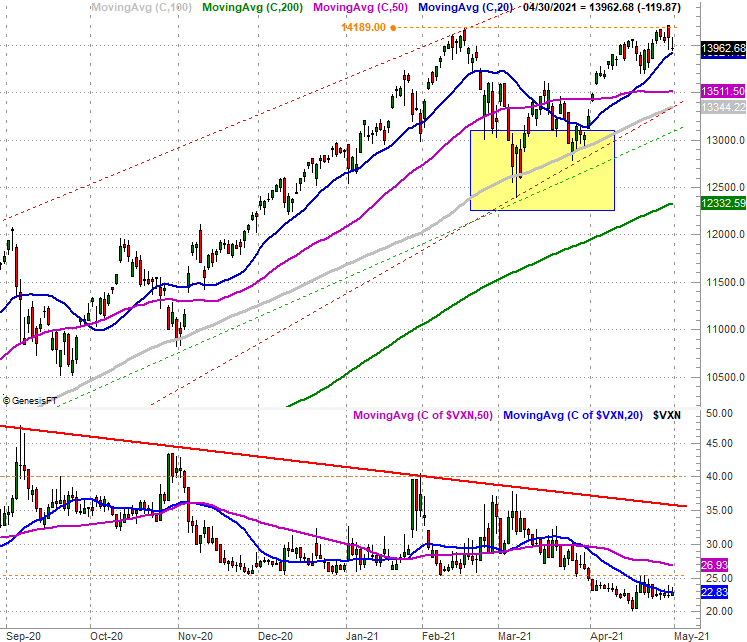
Same thing for the NASDAQ Composite... it tumbled on Friday, but even with that selloff it remains above all of its technical floors, including the 20-day moving average line (blue) at 13,921. The rally up and off of support levels back in March (highlighted) was just so strong that there was plenty of room for a little lull.
NASDAQ Composite Daily Chart, with VXN
Source: TradeNavigator
Things change just a bit -- or maybe more than a bit -- when zooming out to a weekly chart. Take a look. From this vantage point we see a handful of red flags. One of them is the very small low-to-high range with last week's bar, with the close near the bottom of that range. We saw something similar a week earlier...at least with its relatively narrow range.
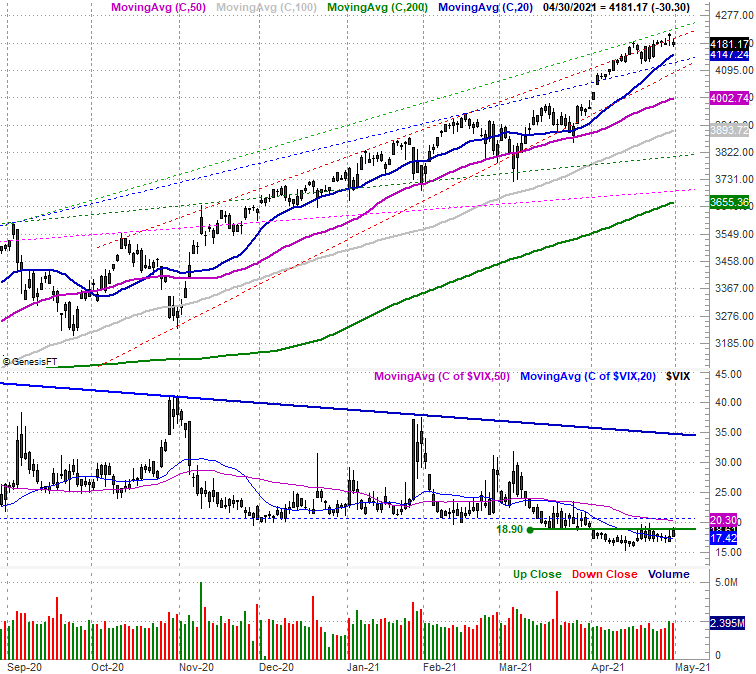
S&P 500 Weekly Chart, with VIX
Source: TradeNavigator
It's a concern just because it's a subtle sign that the rally is slowing down as disinterest ramps up. That makes sense given the time of year too. That is, we typically see a lull in trading activity as spring turns into summer. Given the sheer scope of the 90% runup from last March's low, a little disinterest could easily be an omen of a selloff. The whole "sell in May and go away" thing doesn't help either.
Then there's the Volatility Index, or VIX. We've warned traders several times of late that it's too low --dangerously so. That in and of itself isn't dangerous, but it does show levels of complacency that typically materialize at market tops. Worry is only merited when the VIX itself starts to move higher, suggesting traders are growing worried. That worry could/should coincide with selling. Although the VIX didn't move meaningfully higher last week, it is putting upward pressure on a ceiling right at 20.0 (blue), dashed)... resistance that used to be a technical floor. It's another subtle sign that traders are mentally testing the possibility that the broad market may be about to roll over.
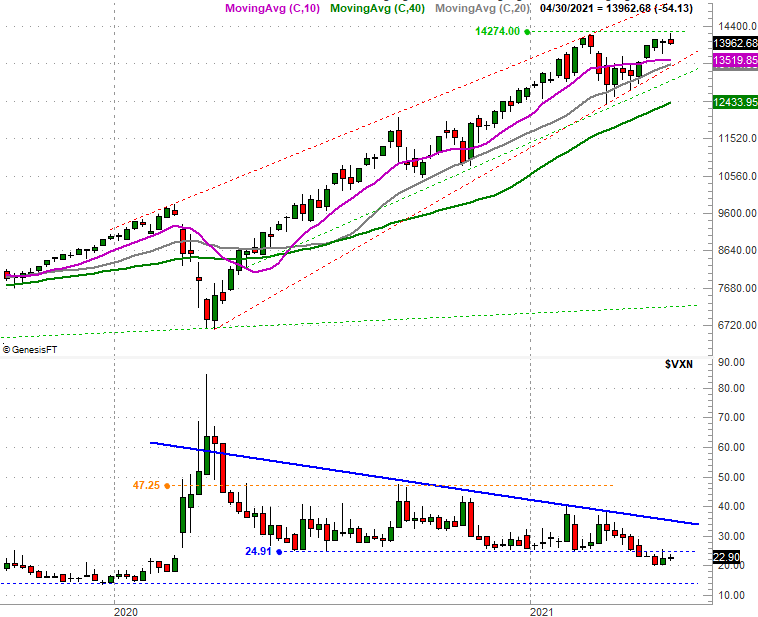
Something similar can be said of the NASDAQ Composite's weekly chart. That is, the NASDAQ's Volatility Index seems to have stopped falling and is at least testing higher highs. At the same time, it's curious that the composite itself was able to test February's high around 14,274 without actually pushing past it last week. In fact, the composite appears to have been repealed by it, forcing last week's close near the absolute low for the week.
NASDAQ Composite Weekly Chart, with VXN
Source: TradeNavigator
While a few red flags may be waving here, the rally is still intact. We can only keep a watchful eye on the things we know will signal the beginning of trouble. That's first and foremost the volatility indices and the way they're both now testing technical ceilings, and the short-term moving averages. Do know, however, that the NASDAQ's big make-or-break level is the 13,500 area where a bunch of support lines are converging.