
Weekly Market Outlook – Not Quite the Bounceback It Seems To Be On the Surface

The bulls hit the ground running right out of the gate last week, reversing course from the prior week’s bearish end. All told, the S&P 500 gained 2.5% for the five-day stretch. The NASDAQ Composite fared even better, rallying 4.0% to reach a record high that the S&P 500 index didn’t. In fact, the NASDAQ dropped a key bullish hint that its counterpart didn’t (aside from the new high).
In both cases though, there’s something of a red flag with last week’s recovery effort. It’s still too soon to dive all the way in with a blindfold.
We’ll talk about this in our analysis below. Let’s first look at last week’s economic reports and then preview what’s in the economic news lineup for this week.
Economic Data Analysis
There was only one item of any real interest posted last week. That’s July’s services index update from the Institute of Supply Management, rounding out the prior week’s look at the ISM manufacturing activity report for the same month. Like its counterpart, the services figure fell after June’s slight uptick, rather than inching higher as expected. Note that in both cases it’s difficult to say a new downtrend isn’t developing, which of course is a bearish clue… albeit not an ironclad one. The ISM is only an opinion-based poll, after all.
ISM Manufacturing, Service Index Charts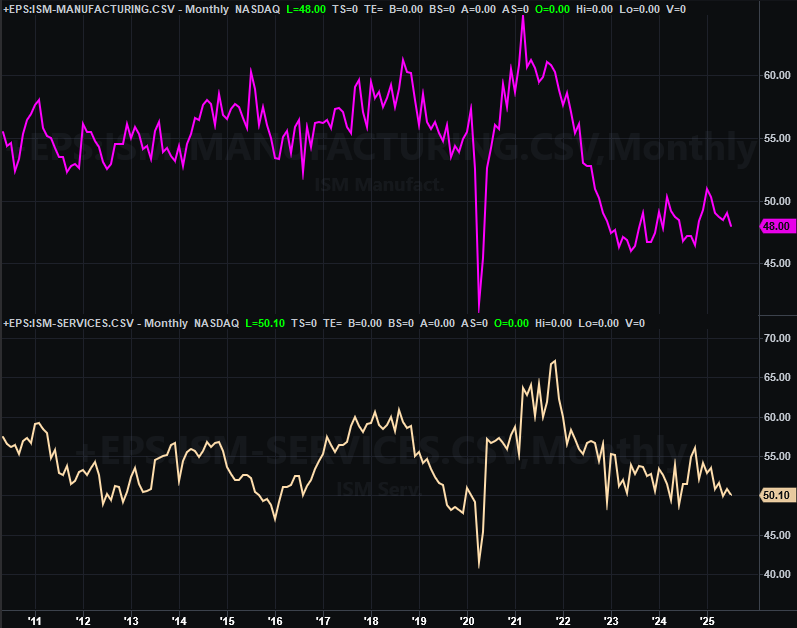
Source: Institute of Supply Management, TradeStation
Everything else is on the grid.
Economic Data Report Calendar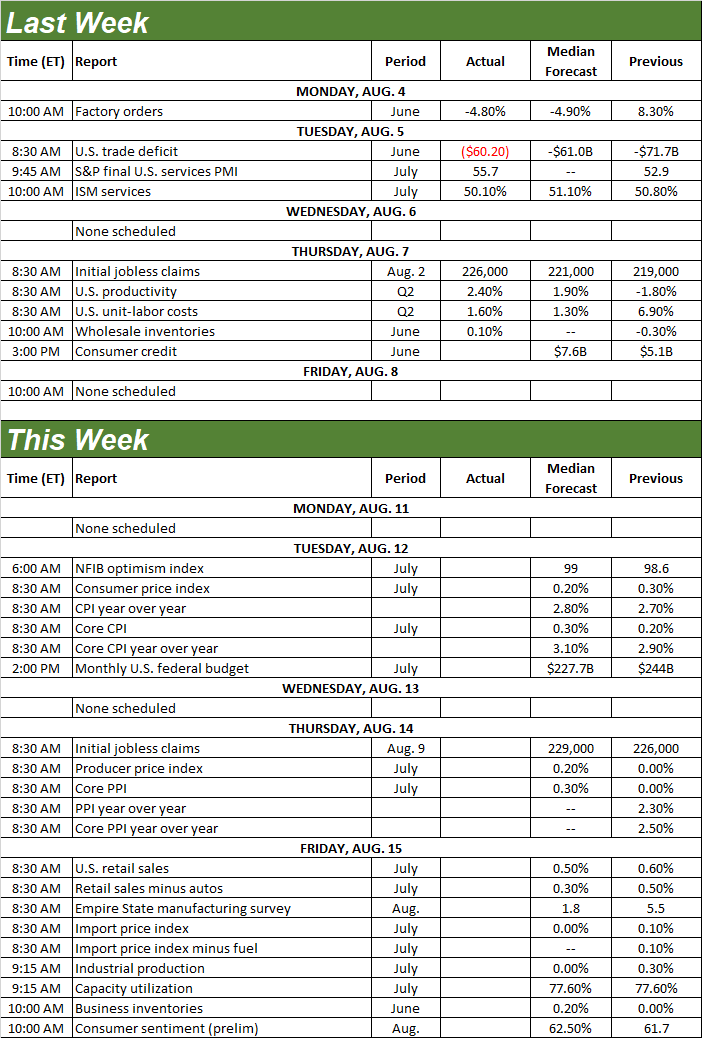
Source: Briefing.com, TradeStation
This week’s pretty well loaded, particularly if you’re trying to get a read on when or if interest rates are going to be cut in the foreseeable future. Tuesday’s consumer inflation data followed by Wednesday’s producer inflation data will be the biggies. You may recall we’re seeing something of a split here, with consumer prices ticking higher while producers’ costs dwindle. Economists are calling for more of the same this time around, although the PPI numbers should mostly be flat with June’s levels.
Consumer, Producer Inflation Rate Charts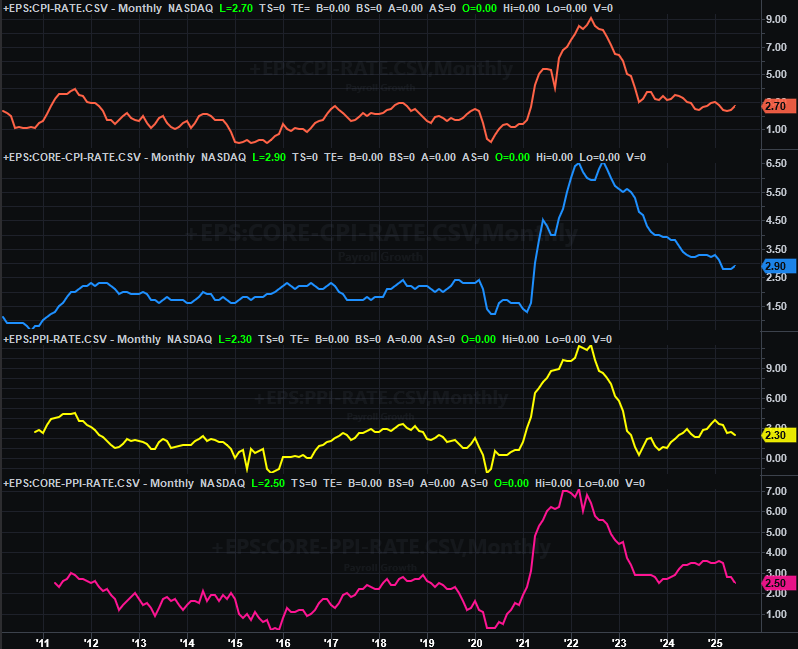
Source: Census Bureau, TradeStation
If inflation ticks upward again, this of course is going to make it tougher for the Federal Reserve to cut rates when there’s a scheduled opportunity to do so next month. As it stands right now, the market’s saying there’s a 90% chance we’ll see a quarter-point cut… a relatively dangerous and uncertain bet, all things considered.
Friday’s retail sales data might play a small part in what the FOMC decides, albeit unofficially. June’s figures were up a little, and are expected to be up again in July. Just note that this shallow growth trend of late has also been a bit wobbly and inconsistent. It’s technically good enough to keep things moving forward though.
Retail Sales Charts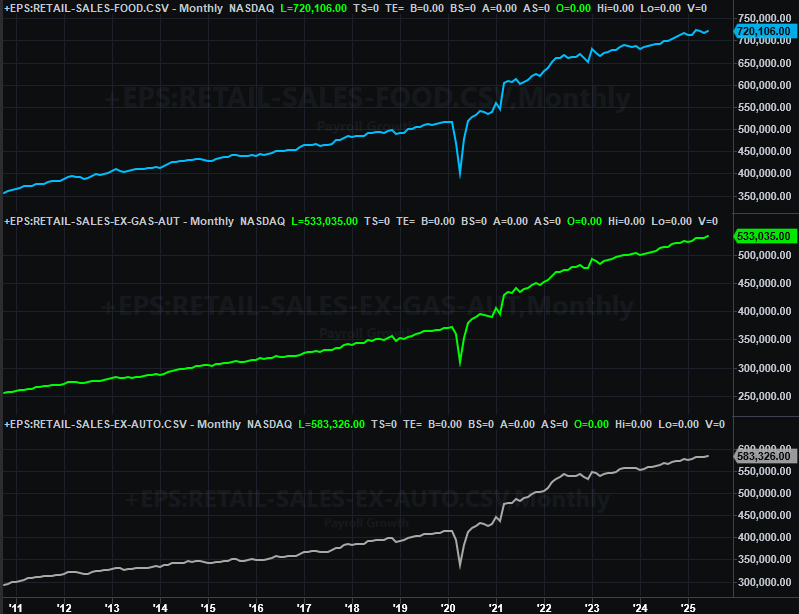
Source: Census Bureau, TradeStation
Also on Friday we’ll hear last month’s capacity utilization and industrial production data, which isn’t a factor in determining interest rates, but arguably should be given its strong correlation with corporate earnings as well as the market’s longer-term trend. (It’s also data supplied by the Federal Reserve, so it should be intimately familiar with its ins and outs.) Both data sets seem to be trying to push their way higher. They’re just struggling to do so. The forecasts suggest both will only be flat this time around, making this information a bit useless for now. A surprise, of course, would be telling.
Capacity Utilization, Industrial Production Charts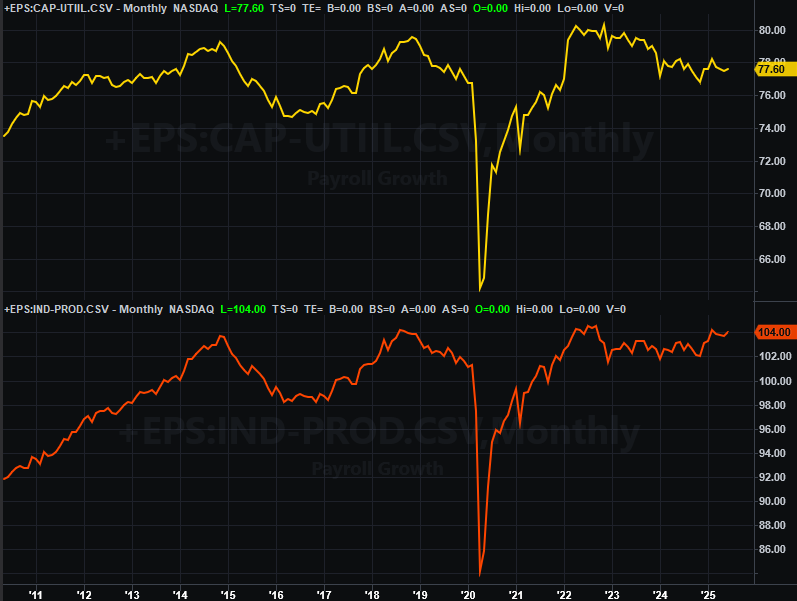
Source: Federal Reserve, TradeStation
Stock Market Index Analysis
This is tricky. It seems like the market snapped back well enough from the prior week’s stumble. As the daily chart of the S&P 500 below illustrates, the index also marched back above the 20-day moving average line (blue) it tumbled under a week earlier. This is bullish. Except, the volume behind the effort was rather anemic. This doesn’t appear to be a consensus effort.
S&P 500 Daily Chart, with Volume and VIX 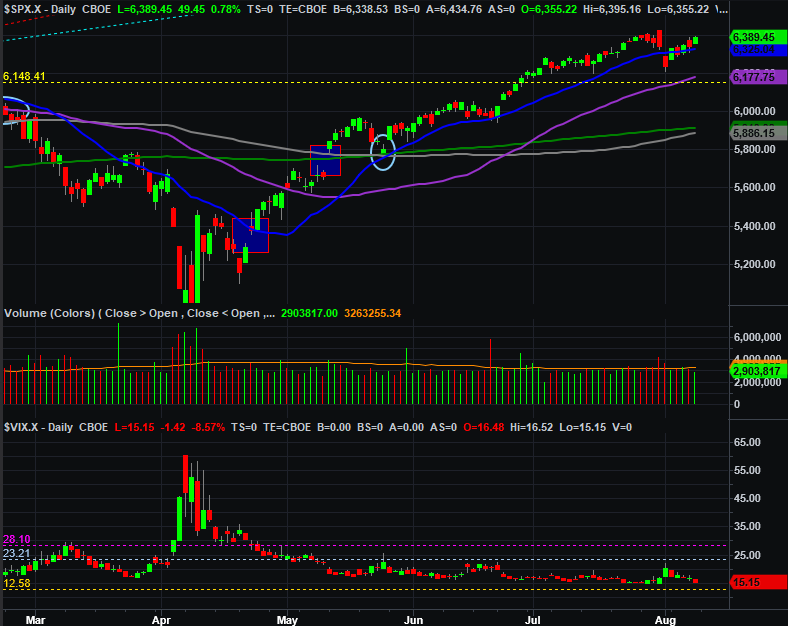
Source: TradeNavigator
Now let’s zoom out to a weekly chart of the S&P 500. Yes, it’s a complete reversal of the prior week’s bearish “outside day.” In fact, last week was a bullish “inside day,” in that the high was below last week’s open, and the low was above the prior week’s close…meaning it was completely contained within the previous week’s open/close range, and pointed in the other direction. This is a decent technical indication of a reversal effort (although you’d typically want to see this happen after a prolonged move. So, let’s not read too much into it). Still, small hints are still hints. That being said, the fact that the S&P 500 didn’t make a higher high or push its way above the rising support line (yellow, dashed) that steered it higher for the better part of the past couple of years.
S&P 500 Weekly Chart, with VIX 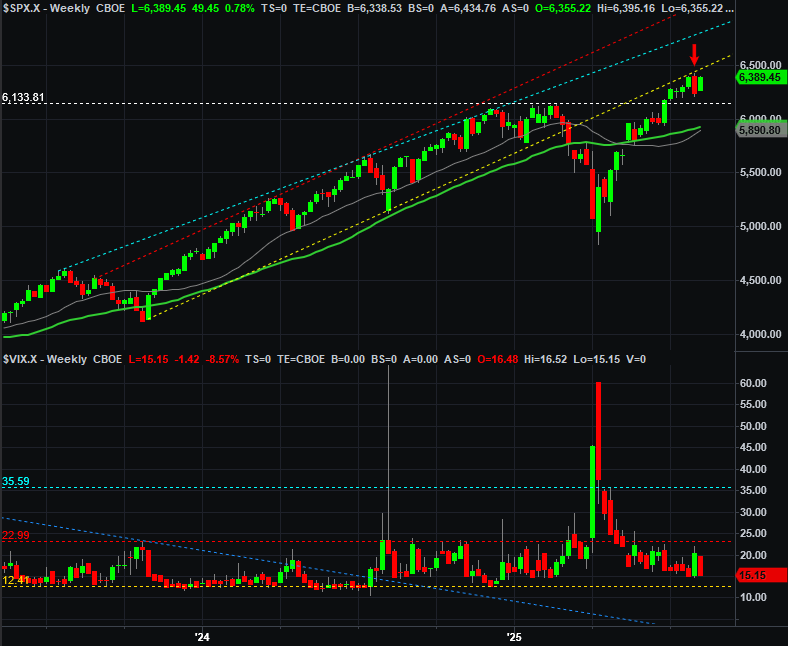
Source: TradeNavigator
It’s curious because the NASDAQ Composite didn’t have the same problem. As its weekly chart shows, the composite did break to yet-another record high, and also punched above what was a minor technical floor (yellow, dashed) last week. Notice there’s room for more upside too. The absolute upper boundary of the long-term rising channel currently stands at 22,930, and is rising fast.
NASDAQ Composite Weekly Chart, with VXN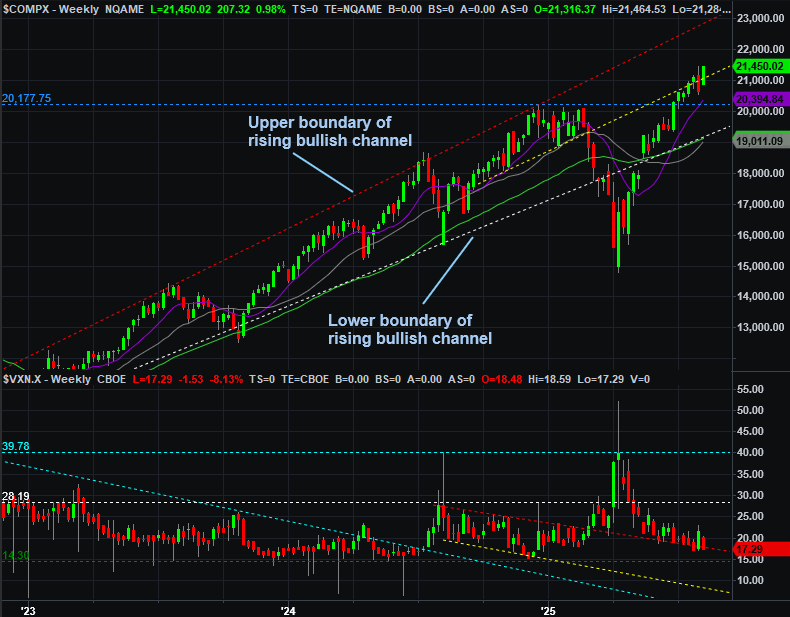
Source: TradeNavigator
Still… not perfect. Like the S&P 500, there wasn’t a lot of volume behind last week’s big 4.0% gain from the composite. And also like the S&P 500’s VIX, the NASDAQ’s VXN is at unusually low levels. This doesn’t make it impossible to continue rallying. It does make it tougher though, particularly in lights of the 45% gain (yes, 45%) from April’s low. Granted, the steep selloff between February and April helped set up this oversized move. Nevertheless, it’s a massive move that’s a tough act to follow.
NASDAQ Composite Daily Chart, with Volume and VXN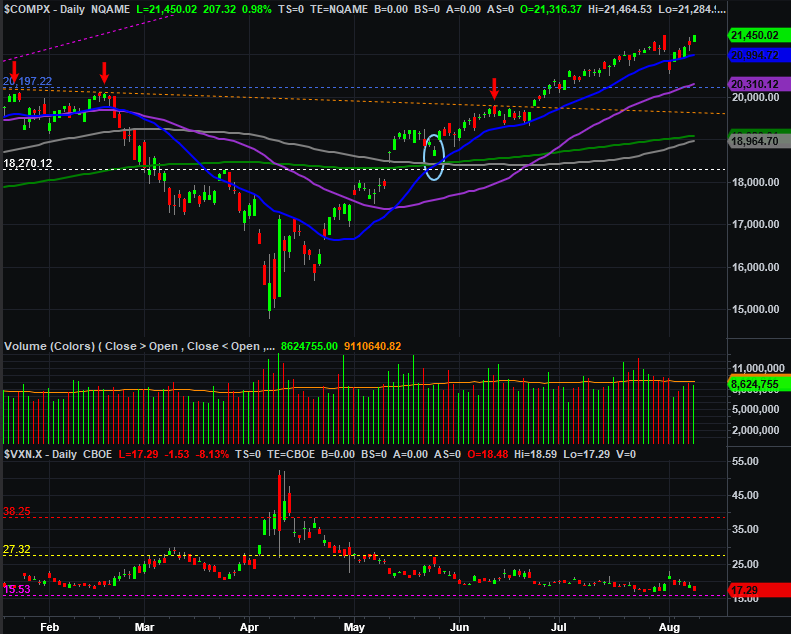
Source: TradeNavigator
So now what? As was already noted, this is tricky. The momentum is bullish, but it seems like it shouldn’t be. It feels like the rally should be out of gas by this point. But, it isn’t.
Just don’t get presumptuous and start predicting a pullback before one starts taking shape in earnest. As we learned just a couple weeks ago, there’s room for a stumble without starting a full-blown selloff. There’s still plenty of technical support below to keep the market propped up.
Whatever the case, this certainly isn’t the time to start plowing into new long, bullish positions. It would take a sizable stumble to really establish a new bullish buying point. The market doesn’t look like it wants to offer one up anytime soon.