Weekly Market Outlook - No Gas Left in the Tank
It ended up being an incredibly unhealthy, even dangerous finish to the week. Between the gap at the open and the pullback from the intraday high, some profit-taking is a distinct possibility. That small move down could turn into a bigger one relatively easily. Nevertheless, seemingly encouraging data about an end to the trade war was enough to send the S&P 500 up to the tune of 1.09% on Friday. For the week, that meant a 0.6% gain ... nowhere near enough to say the market is now off the fence.
We'll look at what's still wrong with the market below -- as always -- after a rundown of last week's key economic announcements and a preview of this week's news.
Economic Data Analysis
Early in the week we got some big, and good, news. Inflation is tame. 'The' inflation rate now stands at 1.71%, down a bit from August's pace. Prices fell on a core and non-core basis, and fell for producers as much as they did for consumers last month.
Consumer, Producer Inflation Rate Charts
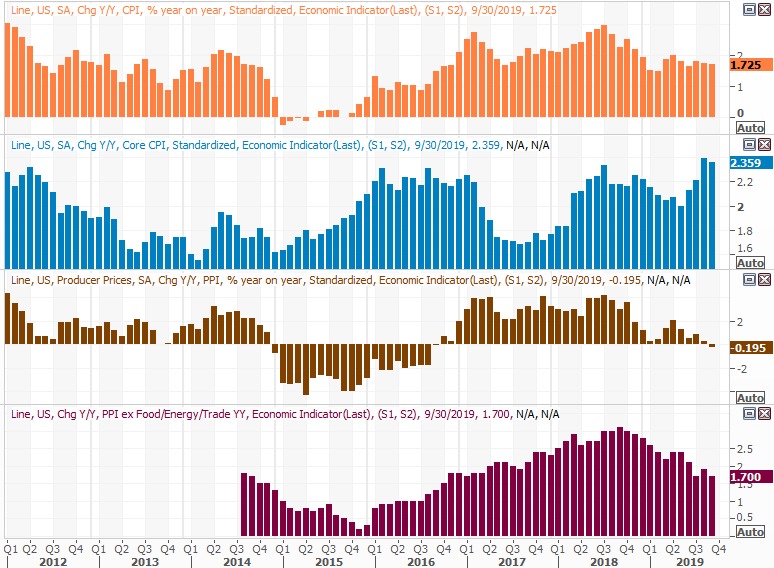
Source: Thomson Reuters Eikon
The numbers are something of a double-edged sword. It would be nice to not need lower inflation rates to stimulate the economy, and it would be nice to see cheaper borrowing rates force price increases. But, it's good to know the Fed can lower rates and not incite rampant, damaging inflation instantaneously.
The only other item of any real interest from last week as the update and crude oil and natural gas stockpiles. Gas inventories continue to build as we move into the cold time of year, though it should be peaking within the next month. Crude oil inventories grew too, for a fourth week in a row. Supply disruptions overseas don't seem to be making an impact. Either way, it looks as if there's a much bigger build underway, with the Q3-2018 lull still being the turning point.
Crude Oil, Natural Gas Inventory Charts
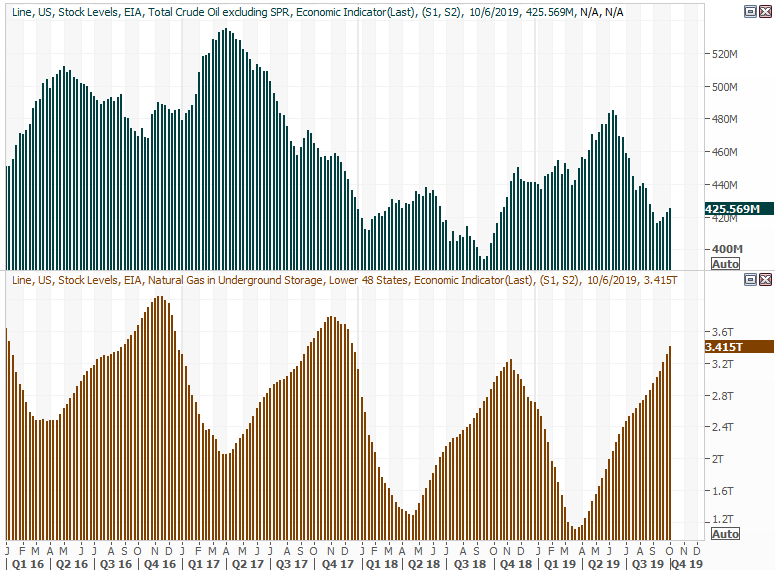
Source: Thomson Reuters Eikon
Everything else is on the grid.
Economic Calendar
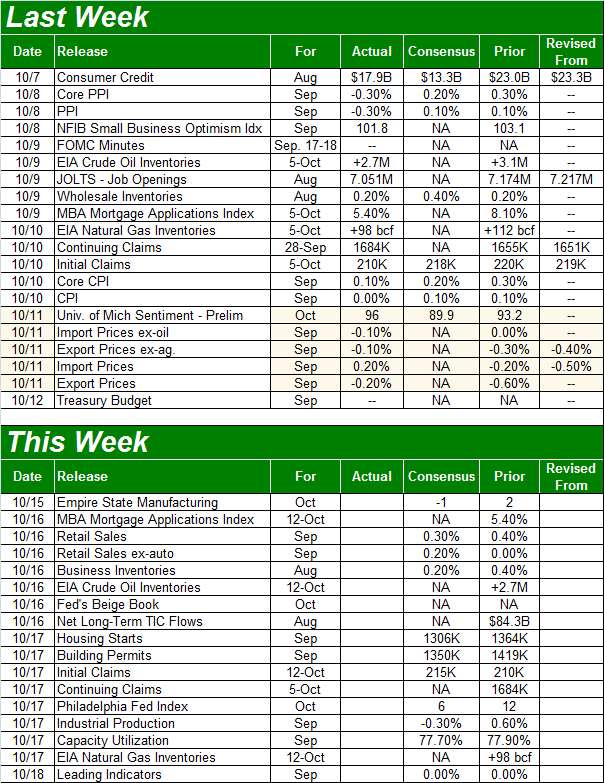
Source: Briefing.com
This week isn't as loaded up in terms of quantity, but a few of the data nuggets we're getting are heavy hitters.
Take, for instance, Tuesday's retail sales report. We need a good one, as it will confirm that despite the naysaying, consumers are still feeling positive enough about things to keep spending. Even though the pros are saying the growth pace slowed last month, it's slowing from a red-hot August.
Retail Sales Growth Charts
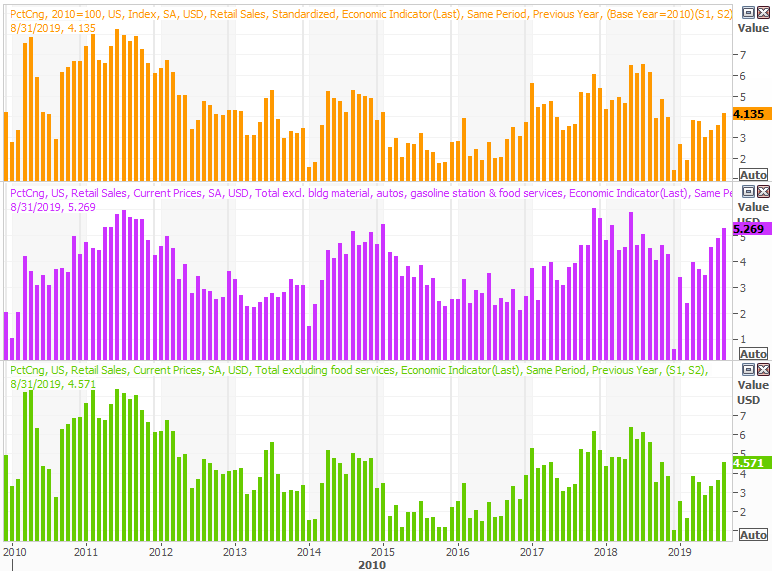
Source: Thomson Reuters Eikon
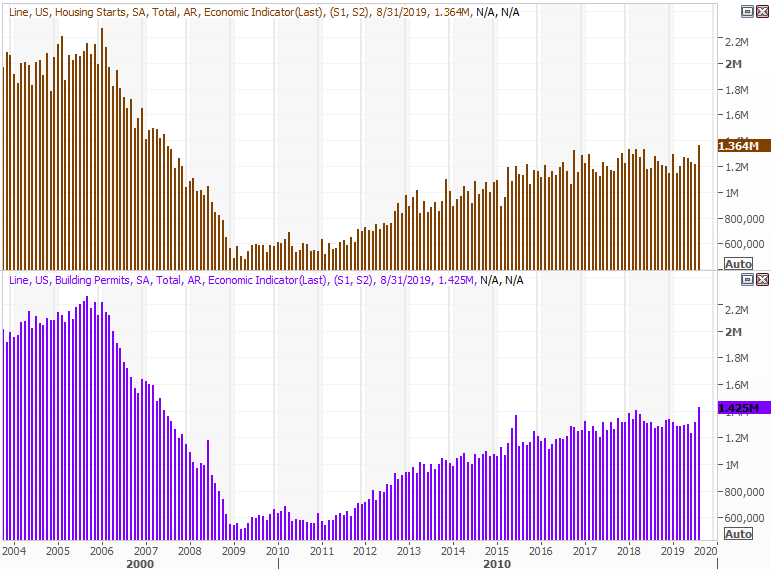
This week also kicks off an in-depth look at real estate demand and purchases through September. The impact of another rate cut should have fully kicked in by now, though economists don't believe that boosted housing starts or building permits. Or, it's possible that even though it's supposed to be seasonally adjusted data, things are winding down for the building season as colder weather approaches.
Housing Starts and Building Permits Charts
Source: Thomson Reuters Eikon
Of course, 'down' from August's numbers would still be solid. Also bear in mind that economists underestimated August's figures, a lot.
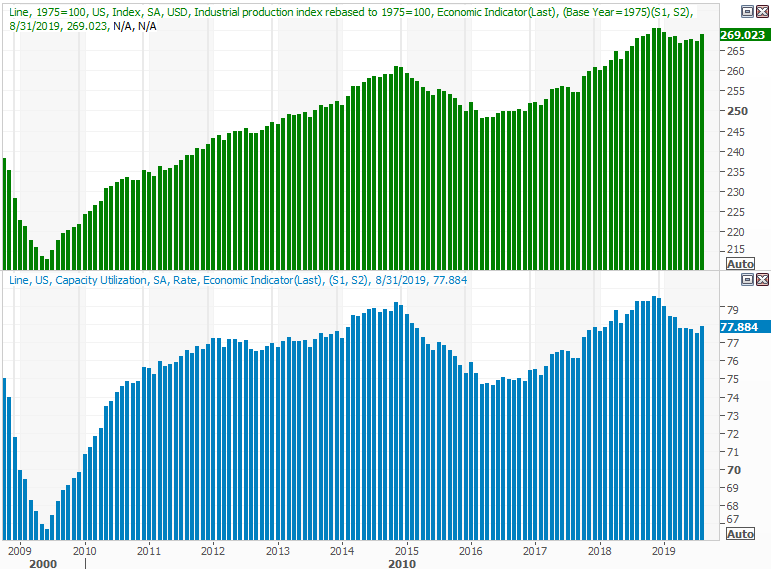
Finally, on Thursday keep your eyes and ears peeled for last month's industrial production and capacity utilization figures. This data is the ultimate proxy for economic activity, which makes the August rebound from both so compelling. Economists are looking for a pullback from that spike, but they underestimated the prior month's read.
Industrial Productivity and Capacity Utilization Charts
Source: Thomson Reuters Eikon
Stock Market Index Analysis
The market left behind a measurable recovery effort last week, but not an ideal one. Stocks are still dangerously close to slipping into a more severe downtrend. And, the odds of the bearish nudge that could put that pullback into motion are now a little higher than they were as of Thursday.
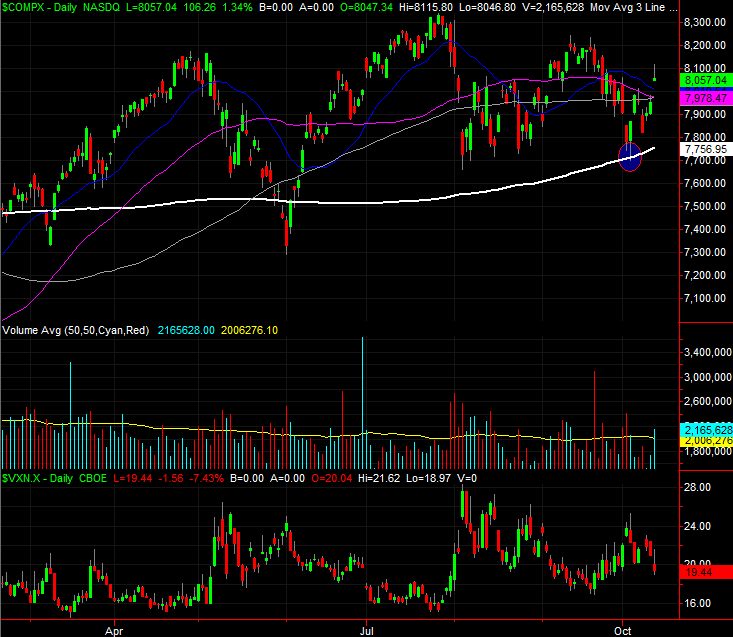
We'll start this week's analysis with a look at the daily chart of the NASDAQ Composite rather than the S&P 500, as it's proven a key line is acting as support. That's the 200-day moving average line, plotted in white. The composite only had to kiss it a couple of weeks ago (highlighted) to rekindle the rally.
NASDAQ Composite Daily Chart
Source: TradeStation
Problem: Traders were stoked enough on Friday to leave behind a pretty big bullish gap that's now aching to be closed. And, though the NASDAQ closed up 1.34%, it peeled back from what was an intraday gain of 2.07%. Investors changed their mind pretty quickly, leaving the composite near its low for the day. The upside-down hammer shape (also called a gravestone doji) from Friday is a subtle clue of a pivot out of bullishness into bearishness.
It's possible the bulls could fade away just enough to close the gap and still remain above that critical 200-day moving average line, currently at 7757. In fact, the gap could be closed without the NASDAQ Composite getting anywhere near the 200-day line. That's going to take a little -- or maybe even a lot -- of extra effort though.
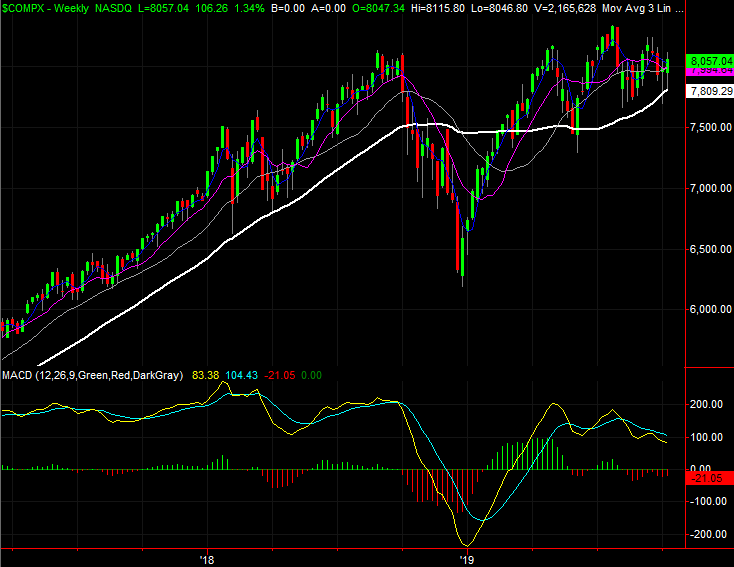
Take a step back and look at the weekly chart of the NASDAQ Composite. It's losing steam. The distance between consecutive higher highs and higher lows is getting smaller, and we didn't even see a higher high with October's peak. Notice that both MACD lines are now trending lower as well.
NASDAQ Composite Weekly Chart
Source: TradeStation
The same basic story for the S&P 500, though with one added detail. That is, all the lows in August as well as the low from earlier this month line up, and the 200-day moving average line is about to intercept that line at 2863.
S&P 500 Daily Chart
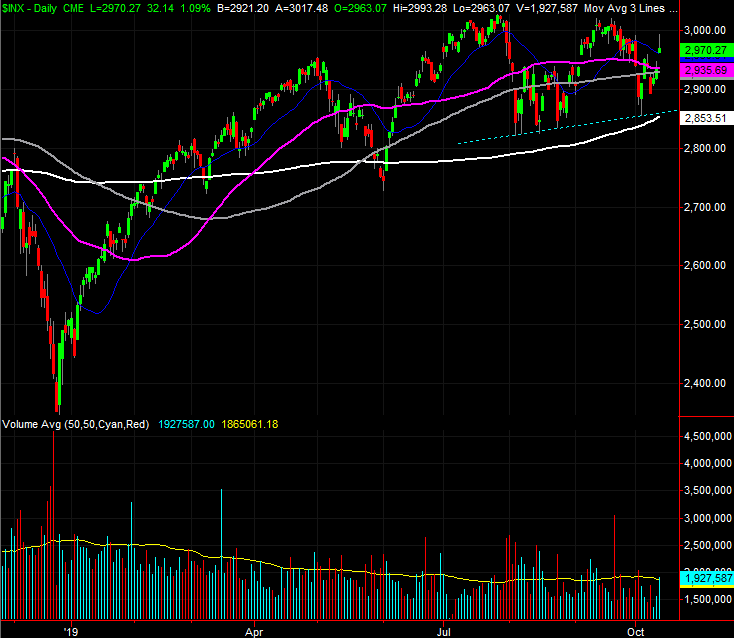
Source: TradeNavigator
Also notice on the daily chart of the S&P 500 as well as the NASDAQ's daily chart that the shorter-term moving averages are moving into the longer-term ones.
This is vexing, by design. Stocks are technically on the fence, and to make matters more complicated, this is the time of year when stocks are searching for a bottom to kickstart the usual year-end bullishness. We're behind schedule, or we may be positioning to buck the normal path this year.
Worse, the third year of a Presidential term tends to be weak through the middle of November and then leads into a strong December. There's still time and room for that to happen, particularly now that the upside of any potential trade deal has played out. There won't likely be another trade summit until next year either, giving the bulls nothing to latch onto. The tank is empty.
That means we have to wait to see how this plays out, and watch the key moving averages closely. If the rally is to remain in place, it will have to take a small step back first... this week.