Weekly Market Outlook - Hurdles Cleared, With Room to Run
 If the December rout was supposed to be the beginning of the end for the bull market, somebody forgot to tell the bulls that. With a boost founded on hope that the trade war will soon be winding down, Friday's 1.3% gain from the S&P 500 translated into a 2.9% win for the week. That's the fourth winning week in a row, leaving the index up 13.8% from its late-December bottom.
Realistically speaking, the bulls are due to take a breather sooner than later. But, the heavy lifting has been done. A whole slew of the technical hurdles that had been standing in the way have been cleared, and cleared in a healthy way.
We'll poke and prod all the key charts below, as always, after running down last week's and this week's key economic numbers. Consumers say they're worried, but a couple of other measures say they're acting otherwise.
Economic Data Analysis
A week ago we pointed out the current consumer inflation rate was tame enough that, if it wanted to, the Federal Reserve could table its rate-hike plans altogether. The inflation rate was leveling off near the Fed's target rate of 2%. Last week's producer price inflation rate, like consumer inflation, fell a bit on a month-to-month basis, and is stabilizing around 2% on an annualized basis.
Annualized Inflation Charts
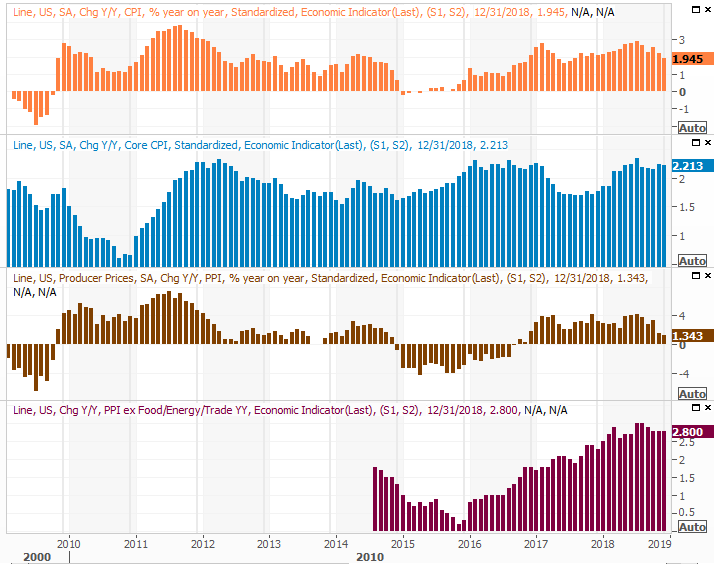
Source: Thomson Reuters
The other big news from last week, though not widely discussed, was December's capacity utilization and industrial output report. The pros were expecting respectable forward progress on both measures, and got a little more than they were expecting. Production reached another record high, and utilization rates pushed to their best levels seen since 2015... before the energy market's meltdown.
Industrial Production, Capacity Utilization Charts
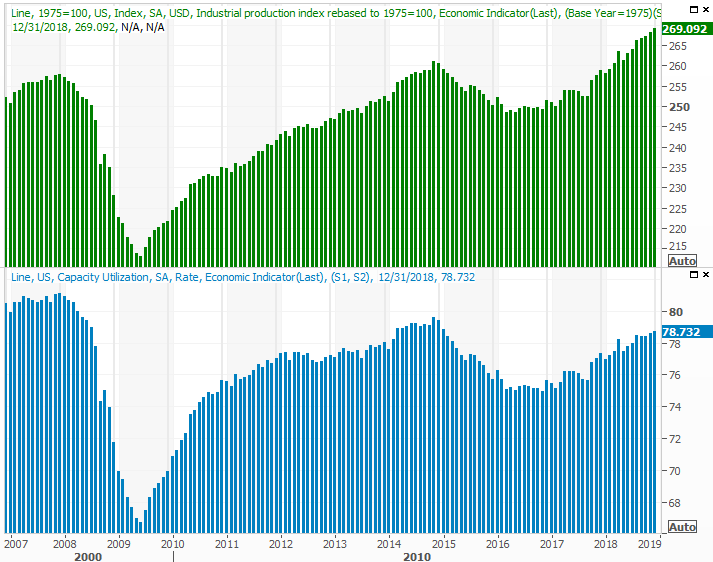
Source: Thomson Reuters
Everything else is on the grid.
Economic Calendar
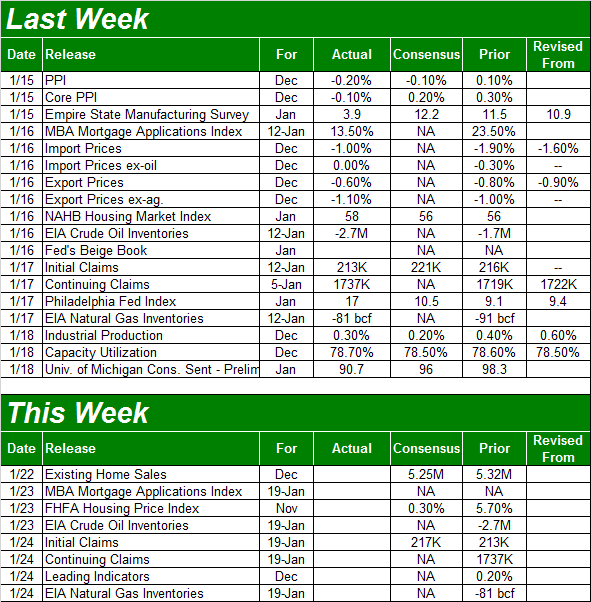
Source: Briefing.com
The three-day weekend leaves us without as much time to squeeze in as many reports this week, and the way the calendar lined up picked off another couple of data sets that would normally be posted this week. Nevertheless, we've got a couple items of interest.
The first one is existing home sales for December, due on Tuesday. Not only will this be something of a preview for new-home sales data in the cards for next week, it will give us a sense of whether or not November's slight uptick in sales was a fluke or a rekindling; analysts are leaning towards it being a one-off fluke.
New and Existing Home Sales, Inventory Charts
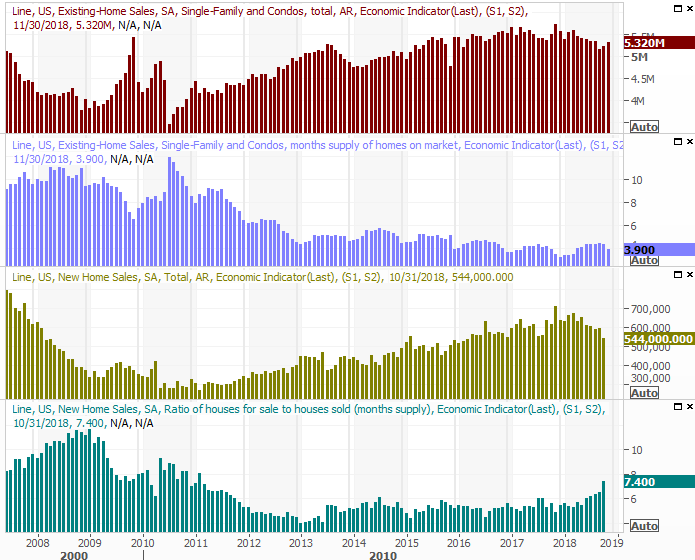
Source: Thomson Reuters
Notice that the new-home sales data on the graphic is only as-of October. The November data was not released by the Census Bureau was a casualty of the government shutdown. If-and-when the federal government restarts completely, the older data will be back-filled.
The FHFA Housing Price Index due on Wednesday will help flesh out that story.
The other noteworthy data nugget coming this week is a report we don't always look at, but certainly have time to examine this week... the weekly oil inventory report.
Oil inventory levels started to surge in October, sparking a sizeable setback in crude oil prices. Unlike past buildups though, that upswing was quelled pretty quickly. As of last week, stockpile levels started to move decidedly lower. Crude prices have rebounded somewhat, but haven't responded quite as firmly as one would expect given inventory levels. Another lower reading could really push oil prices up in a bigger way that's yet to happen.
Crude Oil and Natural Gas Inventory Charts
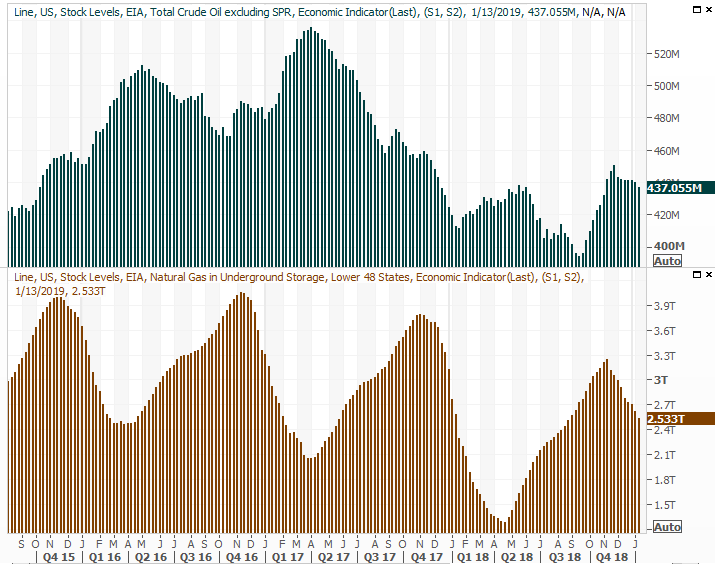
Source: Thomson Reuters
Natural gas prices are also trending lower after a pretty big peak around October, but that's only the result of a pretty reliable seasonal cycle. It's going to move lower from here, but the end to winter-driven demand is already coming into view.
Stock Market Index Analysis
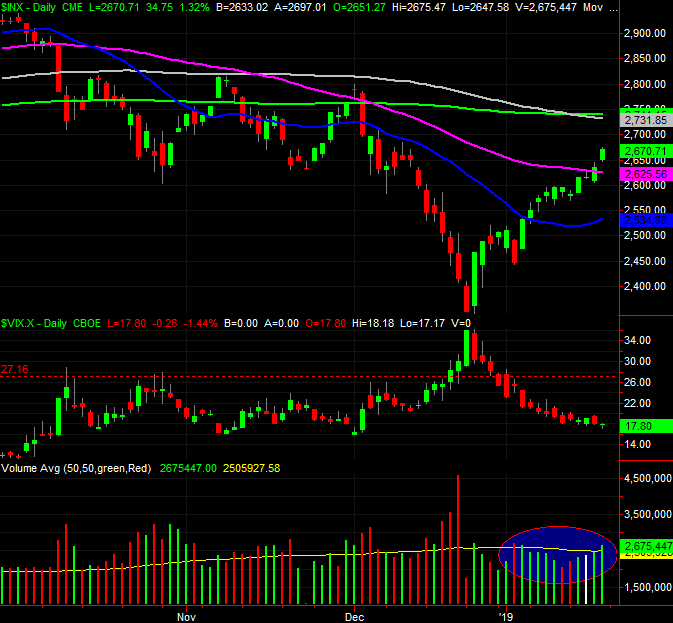
A week ago, our only real lamentation with the market's rally was below-average (and fading) volume. That concern was wiped away last week. The buying volume was growing on the way up, with the highest volume day being Friday... despite the three-day weekend right around the corner. Most traders don't like to take too many stocks into a two-day weekend in a solid environment. This was a three-day weekend in an environment rife with political landmines all around.
S&P 500 Daily Chart, with Volume
Source: TradeStation
Just as noteworthy is the fact that the S&P 500 is now above its 50-day moving average line, plotted in purple on the chart above. That's a start.
Stocks are overbought here, just due to the sheer speed and distance of the reversal that took root back on December 26th. Even just a passing glance at the weekly chart of the S&P 500 below puts it in perspective. But, even with the sharp move higher over the course of the past four weeks, we've still only cut into about half of the pullback seen since September's high. Translation: You can make assumptions here, but you can't make a blind commitment to those assumptions.
S&P 500 Weekly Chart, with Volume
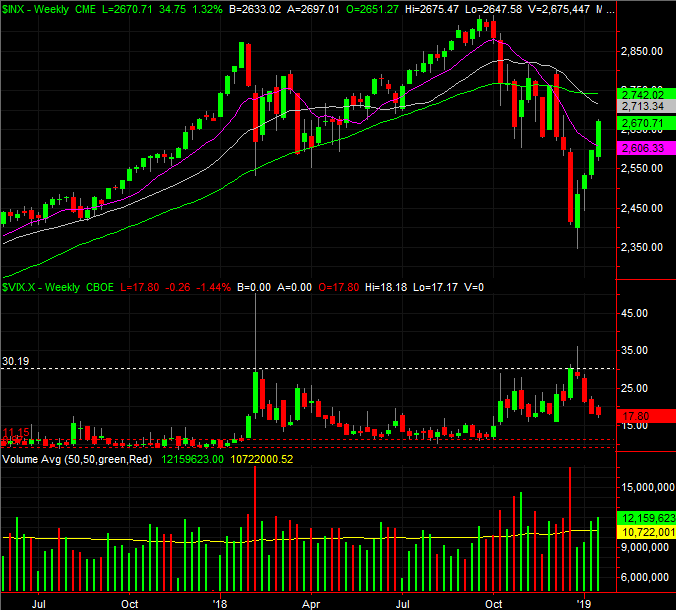
Source: TradeStation
The weekly chart also shows us something else that's telling... that the VIX still has a good amount of room before it finds absolute support between 9 and 11. That gives the S&P 500 some room to keep moving higher, even if the bulls take a break between here and its eventual peak.
Though anything can happen from here, there's one upside for us - the potential range is well framed. The lower plausible limit is the 20-day moving average line currently at 2535, while the upper boundary is the 200-day moving average line at 2742. The market could easily bounce around between that floor and ceiling for a while before moving back out of that range. Even within that confined area though, there's some decent trading opportunity.
The undertow, though, is still net-bullish.
Ditto for the NASDAQ Composite, although the NASDAQ's Volatility Index arguably has even more room to move lower.
NASDAQ Composite Daily Chart, with Volume
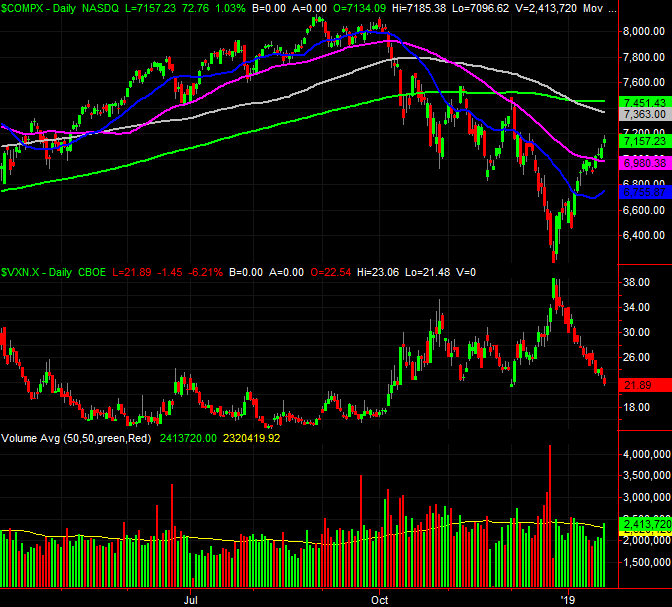
Source: TradeStation
Finally, though the past few weeks have been raucous - for the worse and then the better - the market may finally be getting back in its normal, cyclical groove. And, in terms of the market's typical performance during a four-year Presidential cycle, we should be headed into a relatively bullish few months.
Counting on tendencies to repeat themselves is something of an act of faith, though not a complete stretch. Even in this case though, the usual worst-case scenario during the third year of a four-year term is 'not bad.' On average, it's 'quite good.'
Average Market Performance, Presidential Term
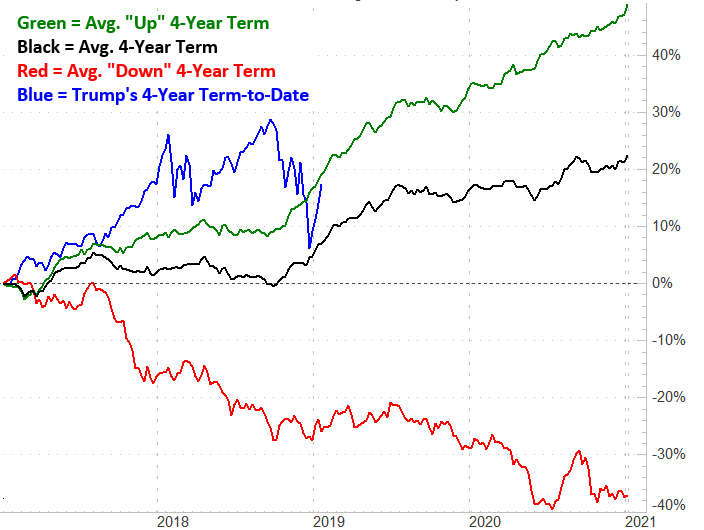
Source: TradeStation
There's still some volatility left to work out from here, both bearish and bullish. But, the current uptrend generally points the market back into the bullish path we'd expect to see here.
Still, headlines ultimately rule the current environment.