Weekly Market Outlook - Hope is Quickly Fading
Last week wasn't a death blow to the rally that's been in place since March's low. But, it was the biggest challenge yet to the huge advance. If the bulls don't act fast and act big, the market could slip to the point where the straggling bulls throw in the towel and let some more serious damage unfurl.
This is of course the time of year when that exact thing is apt to happen.
We'll take a detailed look at the market's breaking points below, as always, and where a hard landing might be made is the bears are allowed to continue on as they have. First though, let's recap last week's economic announcements and preview what's in store for this week.
Economic Data Analysis
There was really only one item of interest for last week... inflation. Consumers are facing some, but producers (factories, production, assembly, etc.) don't. The overall annualized consumer inflation rate now stands at 1.3%, but is up 17% not counting food and energy costs. Annualized producer inflation was down 0.2% in August, but that's still an improvement from the recent plunge. [The disparity also calls into question how and why the nation's factories aren't passing along their lower costs to end consumers.]
Inflation Charts (Consumer Core and Non-Core, Producer Non-Core, Annualized)
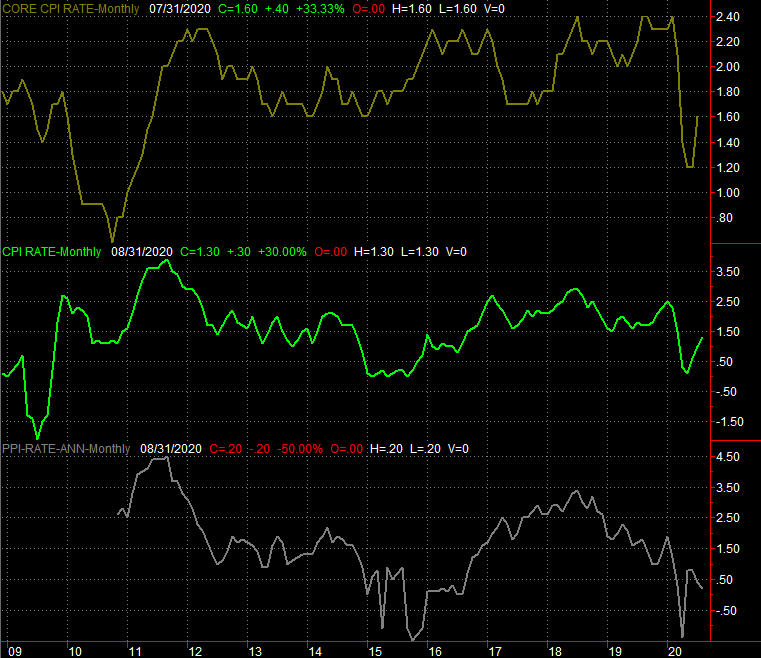
Source: Bureau of Labor Statistics, TradeStation
This isn't a bad thing. Inflation is healthy up to the 2.0% area, and really, consumers could reasonably pay up to 3.0% before rethinking purchases. They might not balk until 4.0%. At current levels, it's encouraging to see that merchants and vendors are able to get slightly better prices out of willing consumers.
Everything else is on the grid.
Economic Calendar
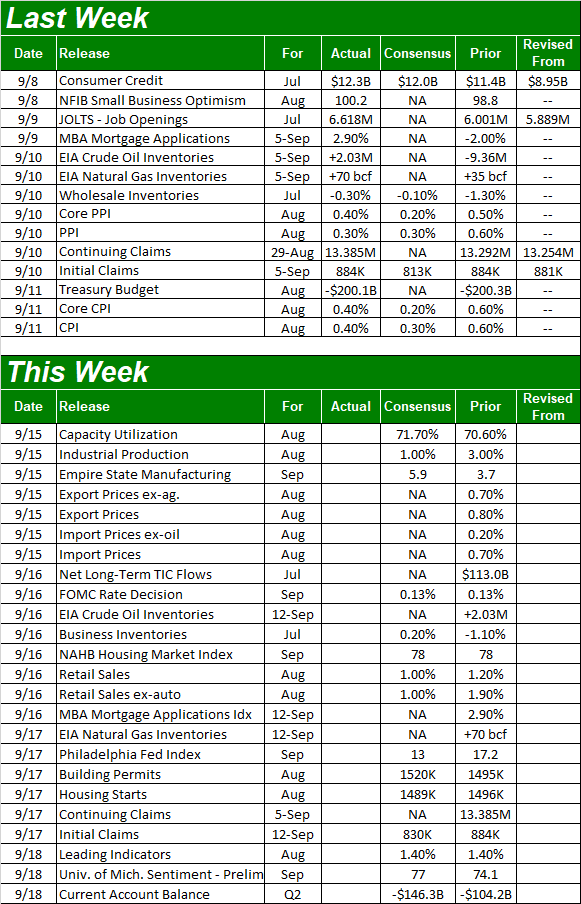
Source: Briefing.com
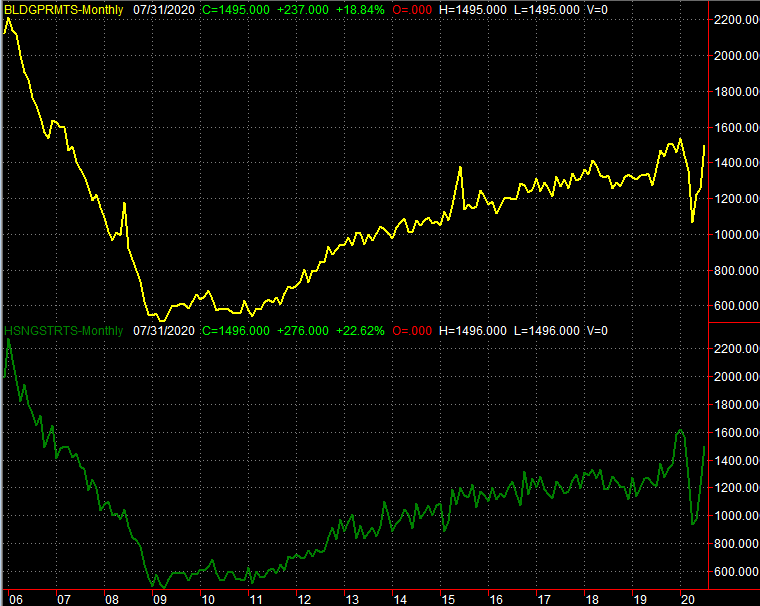
This week is going to be busier, kicking off with Tuesday's capacity utilization and industrial production report. July's numbers were strong - better than expected - and economists are looking for another improvement for August. The pace of growth will slow down, but that's to be expected as the comps get tougher.
Capacity Utilization and Industrial Production Charts
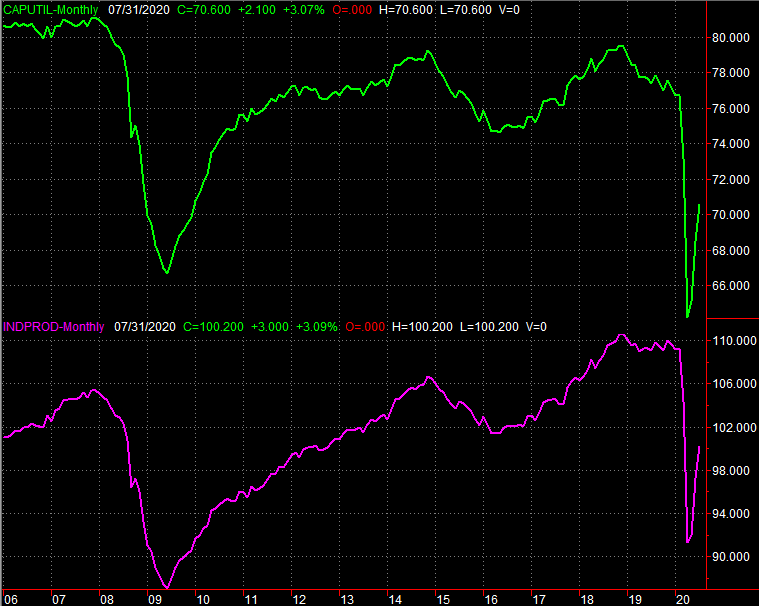
Source: Federal Reserve, TradeStation
Notice that despite improvements, we're still nowhere near pre-COVID levels.
We'll also hear about last month's retail spending on Wednesday. Consumerism has been on the mend in a big way of late. That month-to-month growth pace is expected to slow to 1.0% for August, again, due to higher comparisons. That's still a big uptick though, which would leave the year-over-year growth pace somewhere around 4%. Spending trends are back in line with the reliable forward progress they were logging before the pandemic took hold.
Retail Sales Charts
Source: U.S. Census Bureau, TradeStation
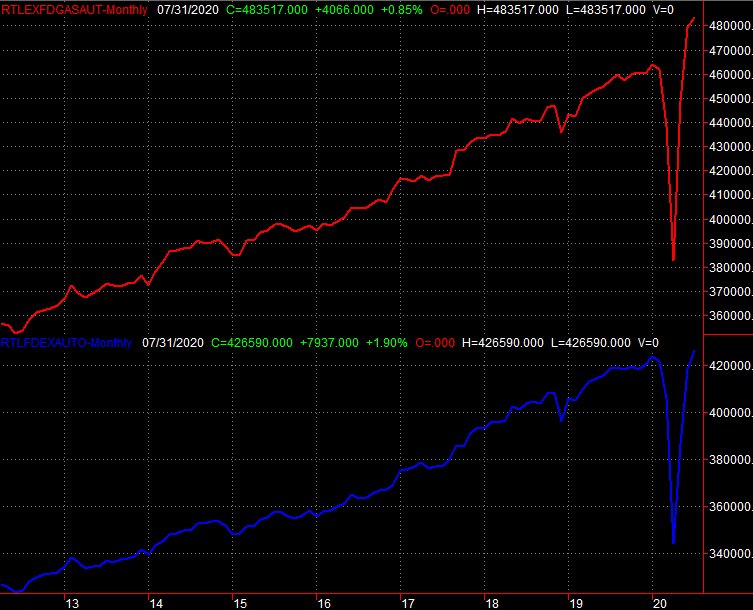
Finally, the last biggie in the queue for this week is Thursday's housing starts and building permits. Ultra-low interest rates have spurred lots of activity, and builders have pushed through the logistics challenges of COVID-19 to find ways to deliver. Forecasters are calling for similar numbers to July, but those numbers are impressive.
Housing Starts and Building Permits Charts
Source: U.S. Census Bureau, TradeStation
The building/real estate piece of the economy is doing its part to keep it propped up in this tough environment.
Stock Market Index Analysis
In simplest terms, the market's hanging by a thread. The daily chart of the S&P 500 below puts it in perspective. All it took was a kiss of the 20-day moving average line (blue) on Thursday to spark another wave of selling. That pullback was stopped by the support being offered by the 50-day moving average line (purple), but just barely. One more bad day could get - and keep - the index below its 50-day average.
S&P 500 Daily Chart, with VIX and Volume
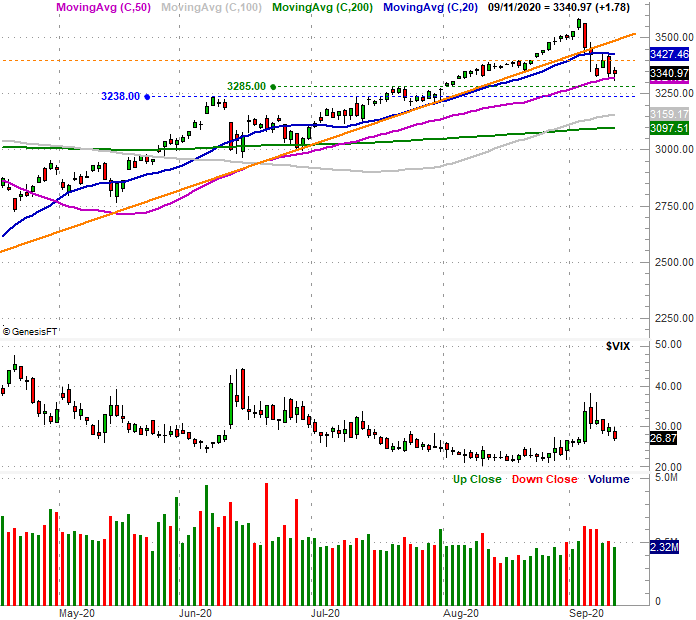
Source: TradeNavigator
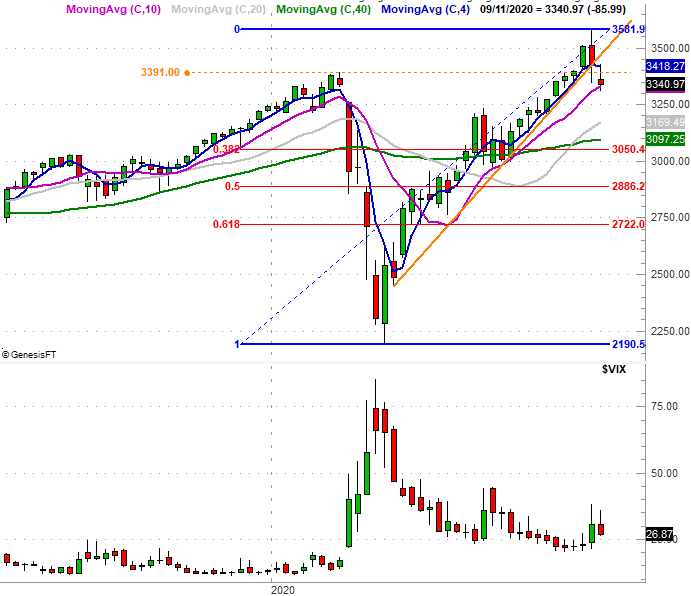
The weekly chart puts things in a better bigger-picture perspective. The 50-day moving average line may still be serving as support, but the straight-line floor that connects all the lows since July has been breached.
S&P 500 Weekly Chart, with VIX
Source: TradeNavigator
The weekly chart of the S&P 500 shows us something else that just became far more important than the market's current support, however. Also plotted on the weekly chart are the key Fibonacci retracement lines framed by the prior week's high and March's low (or the entire span of this year's rebound). These lines mark the most likely landing point for any pullback that's allowed to fester and turn into something more. The first one to watch of course is the 38.2% retracement level, at 3050.4. But, do note that the 100-day (gray) and 200-day (green) moving average lines are both right above that level right now. Any of them could stop the bleeding, so to speak.
In a similar vein, notice the VIX hasn't really bolted higher. Market bottoms tend to come with the VIX is catapulted upward. We're nowhere near such a fear spike, which means there's room and reason for the market to continue tumbling.
The NASDAQ Composite chart tells us the same story... almost. Friday's close was actually below the 50-day moving average line, and the lower side of the rising bullish channel (orange) that's been in place since April is obviously broken. This is even more problematic for stocks than it seems on the surface, as the composite tends to lead the market higher and lower. Its losses are outpacing other indices.
NASDAQ Composite Daily Chart, with VXN, Up and Down Volume

Source: TradeNavigator
That's seemingly good news for the Dow and other blue chip names, as it could mark the beginning of rotation out of aggressive growth and tech names and into safer Dow-like stocks. And to be fair, the Dow Jones Industrial Average is holding up better than other indices. It's still losing ground though, and inching toward its key support levels.
Dow Jones Industrial Average Daily Chart, with Volume
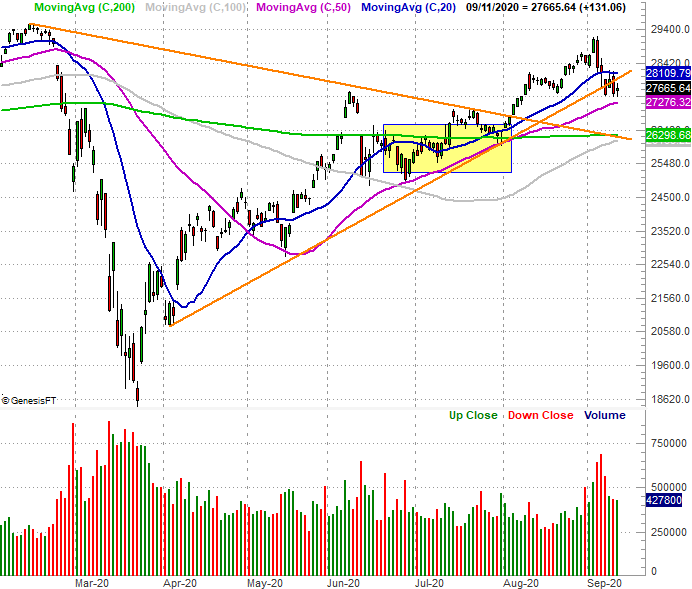
Source: TradeNavigator
In short, stocks are on the fence. They're clearly finding resistance, but also clearly finding support. We could have expected this sort of standoff here and now. The right thing to do here is let this standoff run its course. Last week's pause is actually a good thing, as it fuels the engine (so to speak) for the move that will take shape once the market picks a direction and breaks through its support or resistance.