
Weekly Market Outlook – Don't Jump To Conclusions Just Yet

A week ago we asked of things were so bad for the stock market that they were actually good, meaning had the steep marketwide selloff actually flushed all the sellers out, leaving behind only the buyers? In other words, had the market capitulated?
The answer is… maybe. While last week was quite (as expected) bullish, the fact is, none of the indices actually crossed any lines in the sand that would suggest the “reset” button that keep things moving higher for the long haul has actually been hit. It’s close, but not there yet.
We’ll look at this line in some detail below. Let’s first look at last week’s big economic news, and preview what’s coming this week. Last week’s top news, of course, was March’s mixed message regarding inflation.
Economic Data Analysis
The only item of interest from last week is the Bureau of Labor Statistics’ inflation report from March. It continues to level off, but now we can see it’s cooling even more than expected. Consumer inflation fell to a multiyear low, whether measured on an overall basis, or on a core basis. The overall consumer inflation rate now stands at 2.4%, which is in line with the Fed’s long-term target, giving the central bank a little bit more room to lower interest rates without running an above-average risk of reigniting inflation.
Consumer, Producer Inflation Rate Charts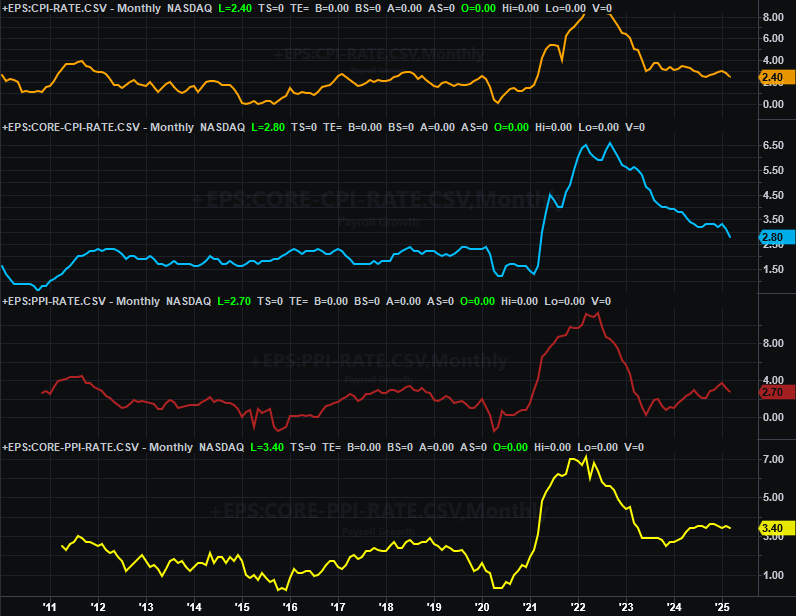
Source: Bureau of Labor Statistics, TradeStation
Everything else is on the grid.
Economic Data Report Calendar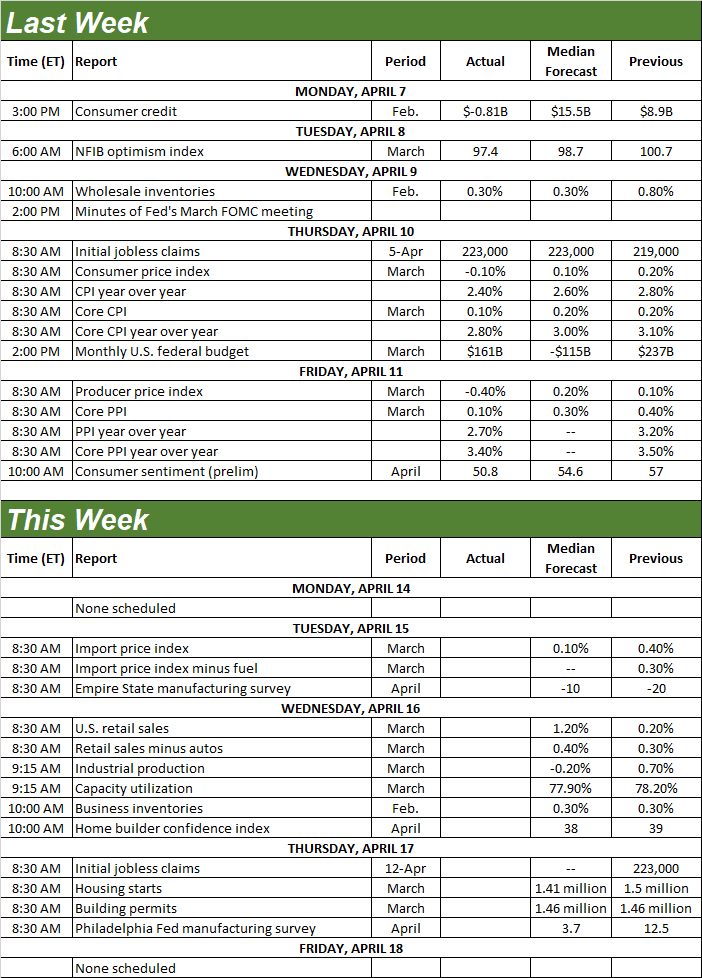
Source: Briefing.com, TradeStation
This week’s got a handful of data nuggets worth keeping your eye out for, particularly in light of last week’s volatility. Traders we’ll be looking for clarity that doesn’t exist right now regarding the market’s bigger-picture undertow.
March’s retail sales will be posted on Wednesday, for instance. You may recall that February’s figures were unexpectedly tepid, suggesting consumers may finally be feeling the pain and pinch that’s been brewing for a while. Or, maybe it was just bad weather. Economists believe retail spending perked up again this time around, although that’s arguably a less-than-completely-confident call.
Retail Sales Charts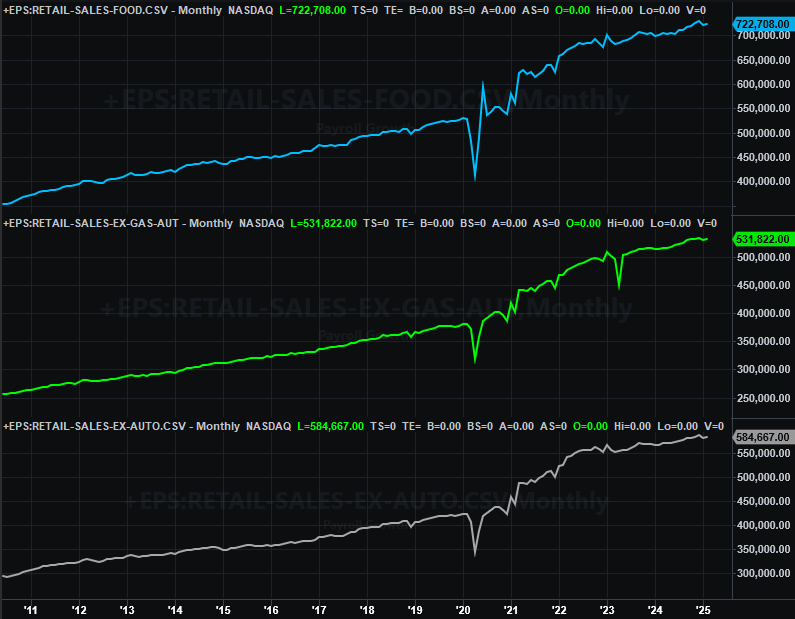
Source: Census Bureau, TradeStation
Also on Wednesday we’ll get last month’s capacity utilization and industrial production data for March from the Federal Reserve. Both have been improving quite nicely for a few months now. But, bad news -- the pros think this cooled last month. Both numbers are expected to fall a bit.
Capacity Utilization, Industrial Production Charts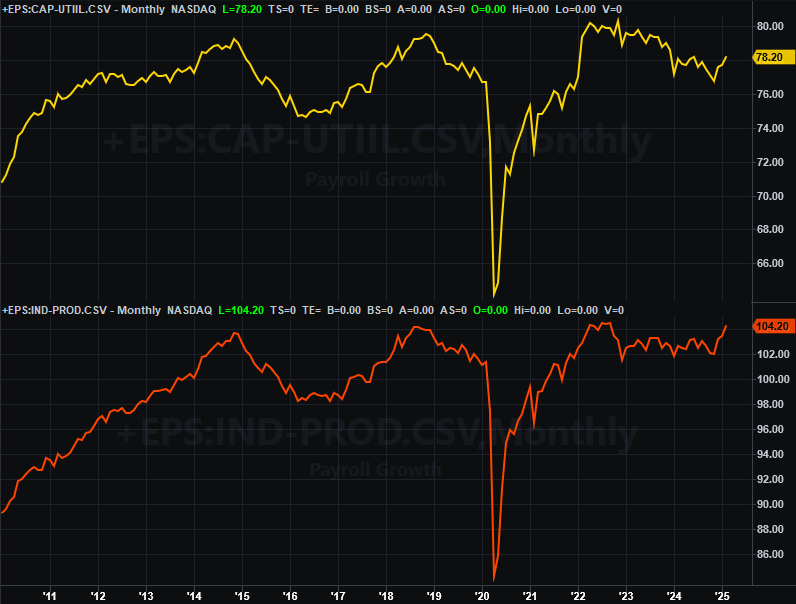
Source: Federal Reserve, TradeStation
Just bear in mind one slight setback isn’t catastrophic. This slowdown could just be the result of just a bit if defensive posturing in anticipation of the fallout from the raging tariff war. It would take at least two or three rough months to turn into a true red flag.
Finally, on Thursday we’ll get last month’s housing starts and building permits, kicking off a couple weeks’ worth of real estate data. Look for slightly lower numbers compared to February’s but only slightly. Either way, it looks like we’re seeing at least modest (even if inconsistent) improvement here. Don’t panic if the numbers dip just a bit for March.
Housing Starts, Building Permits Charts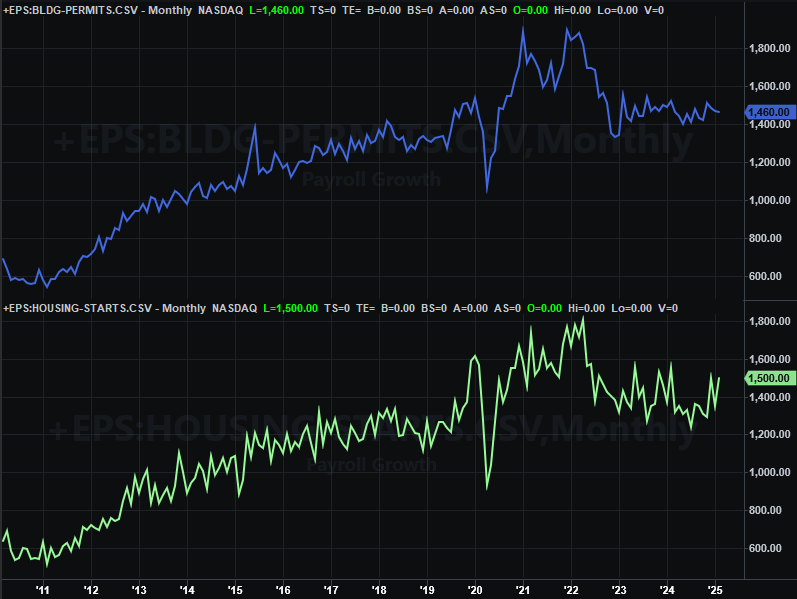
Source: Census Bureau, TradeStation
Stock Market Index Analysis
As was largely expected following the previous week’s rout, stocks rallied last week. A lot. All told, the S&P 500 logged a gain of 11% over the course of the five-day span, but actually ended the week nearly 17% above Monday’s intraday low, when the rebound really started. No real surprise there. As was already said, things were so bad the week before, there wasn’t really anywhere else to go but up.
As the daily chart of the S&P 500 below shows, however, the index didn’t actually snap out of its bearish funk by moving back above any important technical ceilings. It’s still below its 20-day moving average line (blue) currently at 5,517, in fact, which would be the first hurdle to clear.
S&P 500 Daily Chart, with VIX and Volume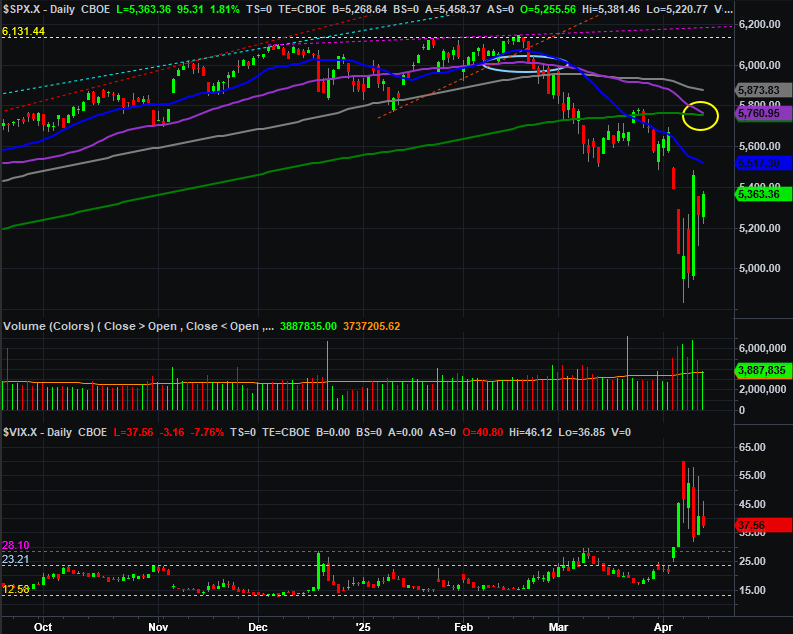
Source: TradeNavigator
The daily chart shows us something else important, and bearish. That’s the so-called death cross, where the 50-day moving average line (purple) falls under the 200-day line (green). It hasn’t actually happened yet, but as you can see within the yellow highlight, it’s now inevitable. This is a problem simply because this will trigger many bearish programmed trades, fueling any selling.
That doesn’t mean the S&P 500 can’t or won’t climb a little more. As was noted, the 20-day line is an important technical ceiling. So are the 50-day and 200-day moving averages now converging at 5,760. The index could advance all the way up to the uppermost of these levels and still not technically snap out of its downtrend. There’s the rub. There’s a lot of room for the bulls to roam without really changing anything for the better.
The VIX of course also has a ton of room to fall now.
Here’s the weekly chart of the S&P 500 to put the wild action since February in its proper perspective. Notice the index made an almost-perfect 50% retracement of its runup from 2022’s low to February’s high. This isn’t a hugely important move; it’s the 38.2% and 61.8% retracements that mean the most. But, there’s some meaningful psychology behind a move that cuts a bull market move almost exactly in half. That may be enough blood to satisfy the bears for now.
S&P 500 Weekly Chart, with VIX and MACD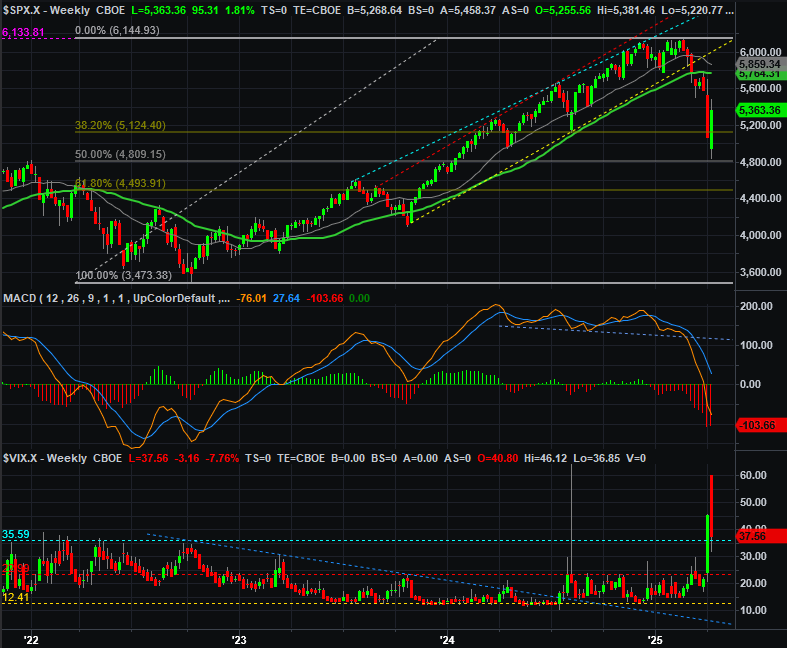
Source: TradeNavigator
The NASDAQ Composite doesn’t tell us much more. In fact, it doesn’t tell us anything else at all. Like the S&P 500, its bull market run was basically cut in half -- almost exactly -- dragging the index well below the lower boundary of a long-term bullish channel. We’re so far into uncharted waters, however, it’s difficult to even make a prediction of what might be next. All we can truly safely say is that even of the NASDAQ continues to climb, it’s going to be a while before we can say it’s back in full-blown bullish mode.
NASDAQ Composite Weekly Chart, with VXN and MACD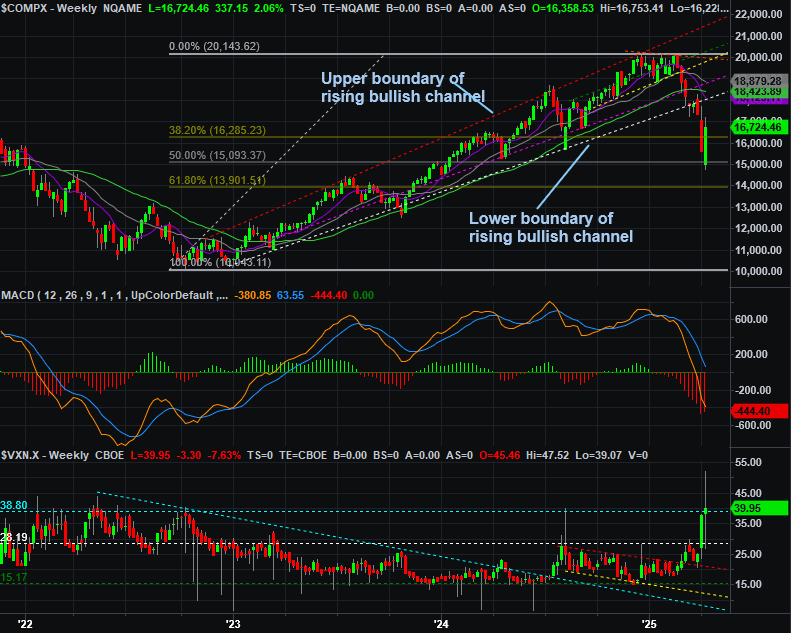
Source: TradeNavigator
The composite made a net gain of 7.3% last week, by the way, lagging the S&P 500’s romp. Its gain from the weekly low was bigger at 13.1%, which of course still trails the S&P 500’s performance. To see the NASDAQ lagging like this is concerning, since it generally leads the market whichever direction it’s truly going at any given time.
NASDAQ Composite Daily Chart, with VXN and Volume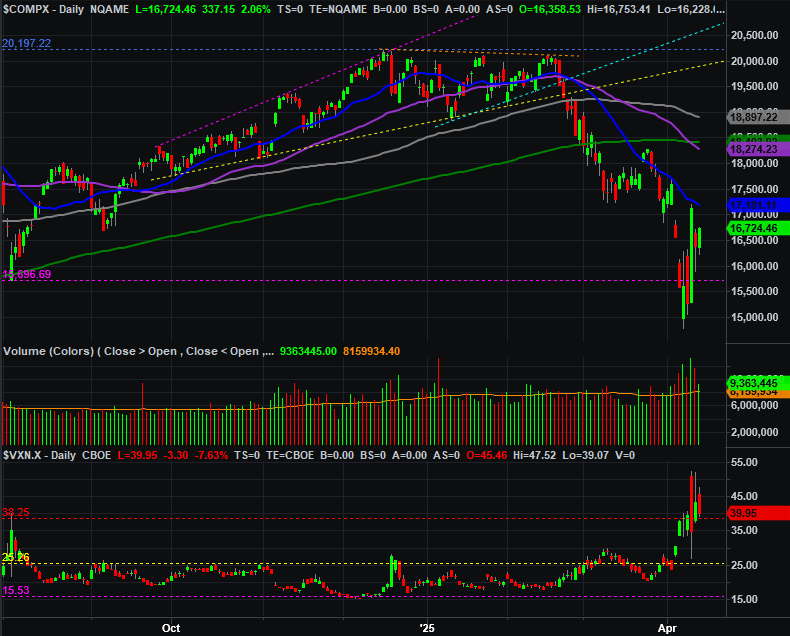
Source: TradeNavigator
And as the daily chart of the NASDAQ Composite illustrates, this index also hasn’t even threatened to fight its way back above its 20-day moving average line (blue) at 17,182/
Bottom line? Don’t dig in too deep here. In fact, the best move to make may be doing nothing and letting these chips continue to fall. The market’s very much on the fence right now, and being pushed, pulled, and prodded from both directions. One side or the other will have to make a stand sooner or later, and likely sooner than later. We’ll wait for that clue.