Weekly Market Outlook: Decision Time - Euphoria, or Reality?
It may have been against the odds, but not only did the market rock and roll last week, it forged its way into new-high territory on Wednesday, and as of Friday's close was still moving deeper into record-breaking highs. Volume, though not exactly brisk, wasn't bad. The move silenced a lot of doubters.
And yet, it's cases like this were traders should be the most cautious. This is a technical breakout, and after three days of bullish persistence, this is where the market could throw a curve ball and up-end the rally while nobody was ready for it.
Or, who knows? This may all be the beginning of a trade-worthy meltup, even if it's not justified from a fundamental perspective.
We'll hash it all it below, as always. First though, let's run down last week's and this week's major economic announcements. They're going to play a big role in extending or breaking the rally effort that's getting a little long in the tooth.
Economic Data
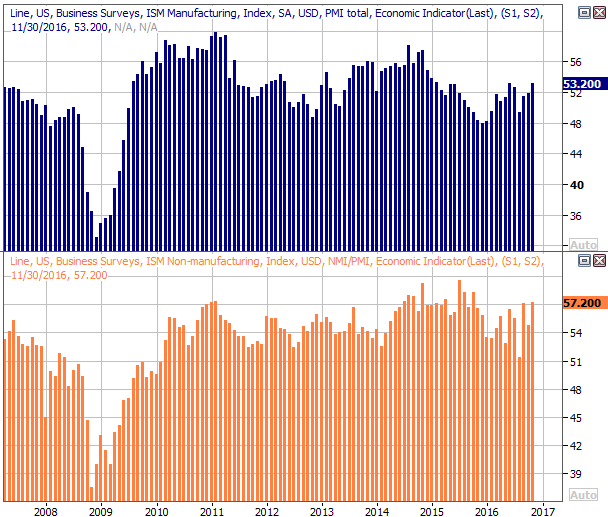
Last week wasn't a terribly busy one for economic news. The only two items of interest were last month's ISM Services reading (rounding out the prior week's look at the ISM manufacturing index), and the first of three December readings for the Michigan Sentiment Index.
Not only are both versions of the ISM indices edging higher, both are now well above the key 50 mark. Yet, we'd like to see a little more upward progress.
ISM Indices Charts
Source: Thomson Reuters
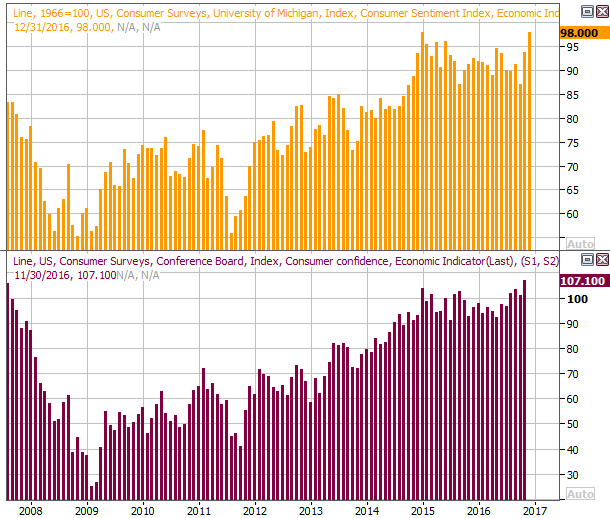
Not surprisingly, consumer sentiment continues to perk up, fueling and being fueled by the rising market. This too bodes well for the market, decidedly ending a rut for both the Michigan Sentiment Index as well as the Conference Board's Consumer Confidence Index two weeks ago. This won't stave off short-term pullbacks, but it does provide a tailwind for the long-term market.
Consumer Sentiment Charts
Source: Thomson Reuters
Everything else is on the grid.
Economic Calendar
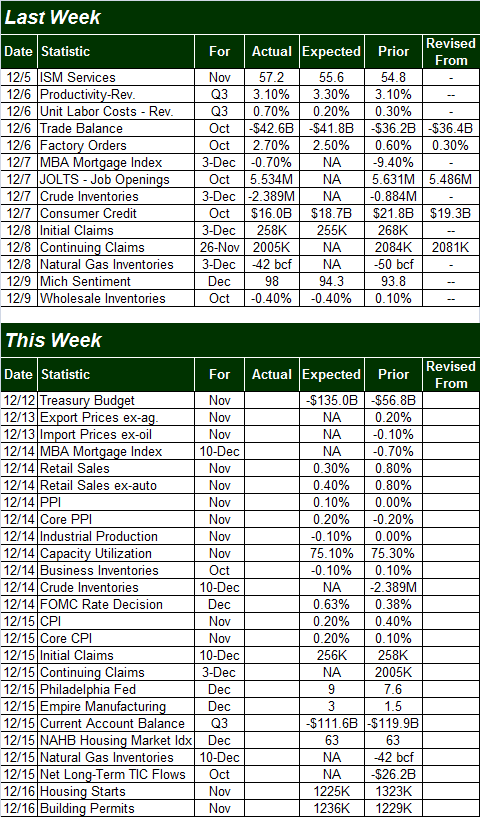
Source: Briefing.com
This week is going to be considerably busier... perhaps too busy.
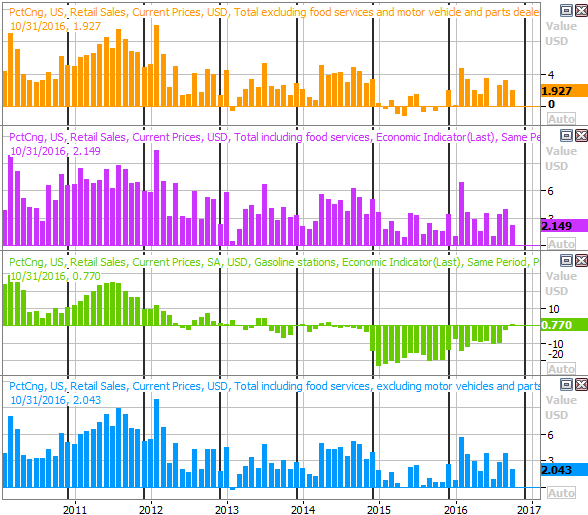
The party starts on Wednesday, with the retail sales report for November. Analysts are expecting slower growth than October's strong spending pace, though growth is expected all the same. A decent reading here will extend a long streak of forward progress. It can't be said consumers aren't doing their part to keep the economy moving. The Trump-nudge may well spur a bullish surprise here.
Retail Spending Growth, Year-Over-Year Charts
Source: Thomson Reuters
It's also a big week for inflation numbers... producer inflation as well as consumer inflation. Economists are looking for higher prices, though tame growth.
Year-Over-Year Inflation Rate Charts
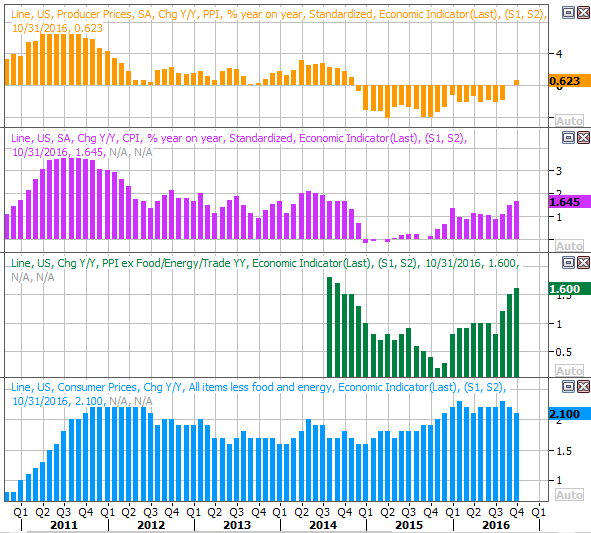
Source: Thomson Reuters
Broadly speaking, we've seen persistent progress here, and inflation by most measures is indeed reaching levels that will force the Fed's hand. In fact, the FOMC will be officially making a decision about a rate hike on Wednesday, even before Thursday's CPI report. The market is planning on a quarter-point increase.
Though it's going to be drowned out by the rest of Wednesday's news, be sure to keep your eyes and ears open on Wednesday for November's capacity utilization and industrial productivity numbers. Experts are actually looking for a slight contraction for both, which is a red flag at the exact wrong time - we need all hands on deck, so to speak, to get the economic revival working at full speed.
Capacity Utilization and Industrial Productivity Charts
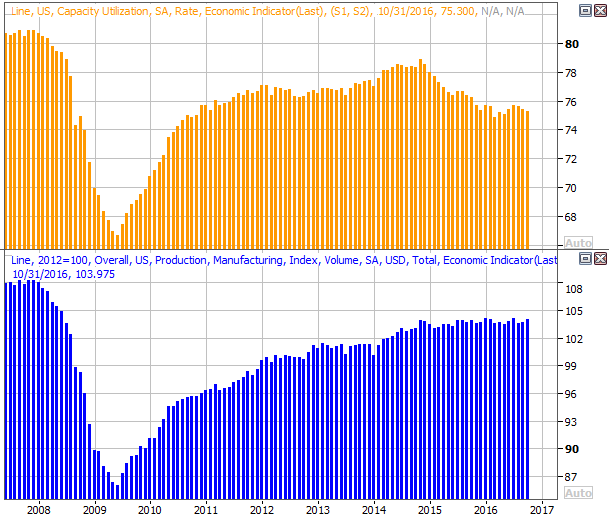
Source: Thomson Reuters
Finally, though it will be anti-climactic by the time we get to it, Friday's housing starts and building permits for November will be worth watching. The former should be down a little, and the latter should roll in just a tad higher. Both will be about even with October's results though.
Housing Start and Building Permits Charts
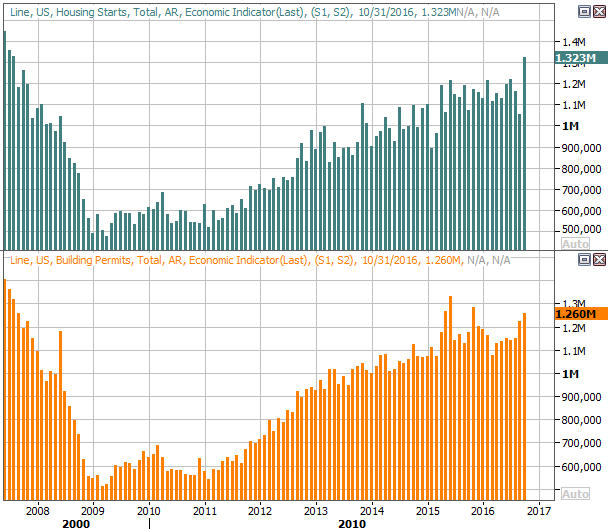
Source: Thomson Reuters
Index Analysis
We'll set the stage this week by first taking a look at the weekly chart of the S&P 500. It's in this timeframe we can see just how big last week's gain was.... a 3.1% romp when all was said and done, which is one of the best weeks we've seen in a while.
S&P 500 Weekly Chart
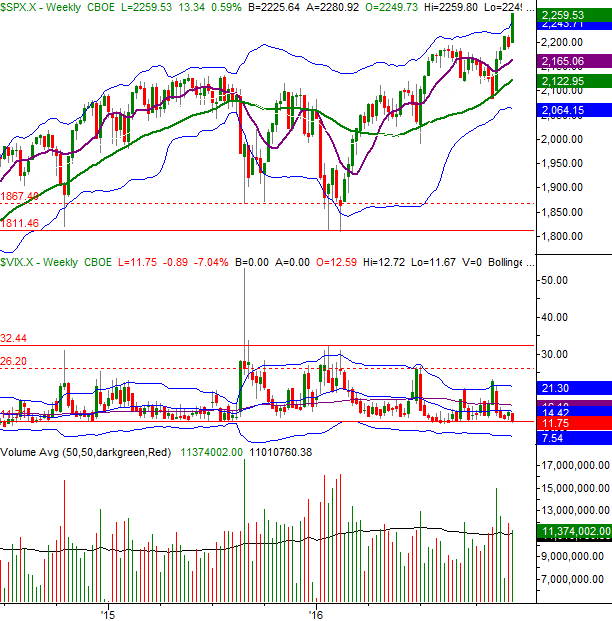
Chart created with TradeStation
Perhaps it was a little too good, however. The S&P 500 poked through its upper 26-week Bollinger band at 2243.7 to a degree -- and this isn't an exaggeration -- not seen in modern history. We've seen bigger uninterrupted rallies than the 8.3% advance we've seen over the past five weeks, so maybe it was just fortunate circumstances that set up this extreme surge. Or, maybe the bulls just got a little overzealous without thinking things through.
It's also in the weekly timeframe we can see the VIX is back at a well-established support level around 11.7.
Zooming into a daily chart of the S&P 500 we can glean a lot more detail about the current situation. By all measures it's decidedly bullish, for reasons other than raw momentum. The PercentR line is well into bullish territory, and a bullish MACD divergence is taking shape.
S&P 500 Daily Chart
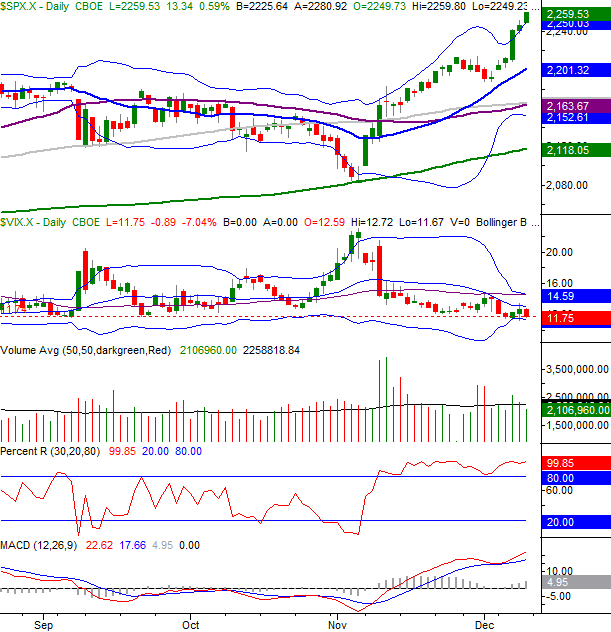
Chart created with TradeStation
Just for a little added perspective, we're going to take a look at a chart we don't usually examine - a look at the S&P 500 and its equity put/call ratio. In many ways it's like the VIX, pointing out the points where extreme bets using options are being made, with a contrarian interpretation usually being the right one (meaning it's bullish when it looks most bearish, and bearish when it looks most bullish).
Well, the put/call ratio is looking awfully bearish right now, in that its uber-low reading says traders are thinking dangerously bullishly. This is the lowest the VIX has been since August, and is decidedly below its lower Bollinger band.
S&P 500 Daily Chart, With Equity-Only Put/Call Ratio
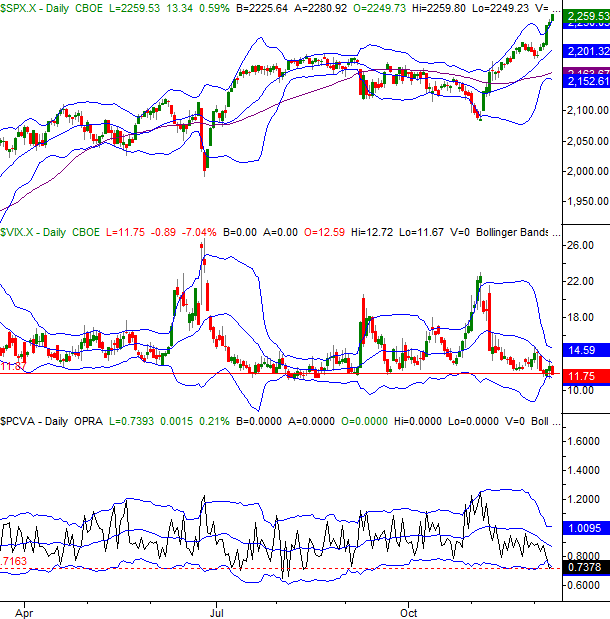
Chart created with TradeStation
Point being, the market isn't just a little overextended. It's a lot overextended, momentum-wise as well as sentiment-wise. One could also argue it's overvalued. Thanks to last week's 3% rally and the 8% runup since early November, the S&P 500 is now valued at a trailing P/E of 22.2 and a forward-looking one of 17.8. Both are well above long-term norms, even if interest rates are still onhe (very) low side.
Bottom line? This is a situation where investors are going to have to make a tough decision. Either they believe the euphoria/hope-driven rally will last even though there's no fundamental justification for current prices, or they think investors are going to open their eyes and realize the market has a valuation problem even of growth is in the cards. The X-factor is the fact that December is historically a good month for the market. The only problem with that X-factor is the simple fact that the S&P 500 is already up 2.7% for the month, versus the typical December gain of 1.5%.
This is a situation where more-than-usual caution is advised. The risk/reward scenario is heavier on the risk and lighter on the reward, even if the momentum indicators are pointing bullishly. Those tools don't start pointing bearishly until after the turn has been made, and there's not a lot more room for near-term upside.