Weekly Market Outlook - Battle Lines Have Been Drawn
The market may have ended the week on a bullish note, but in the grand scheme of things that strong finish didn't negate Wednesday's heavy damage. That is to say, stocks still booked a loss of 0.4% for the week. Worse, the S&P 500 retreated from a key line it needed to hurdle on Friday if the rally was going to be fully rekindled.
All the same, the market remains a 50/50 prospect here.
We'll examine what's wrong and right about the current situation below, as always. First though, let's review last week's key economic news and preview this week's major economic announcements.
Economic Data
We saw a handful of economic announcements made last week, but only a couple of them were of any real importance to us.
The first of those was the housing starts and building permits tallies for April, posted on Tuesday. Starts as well as permits fell short of expectations, but perhaps more alarming is that both fell from March's pace.
Housing Starts and Building Permits Charts
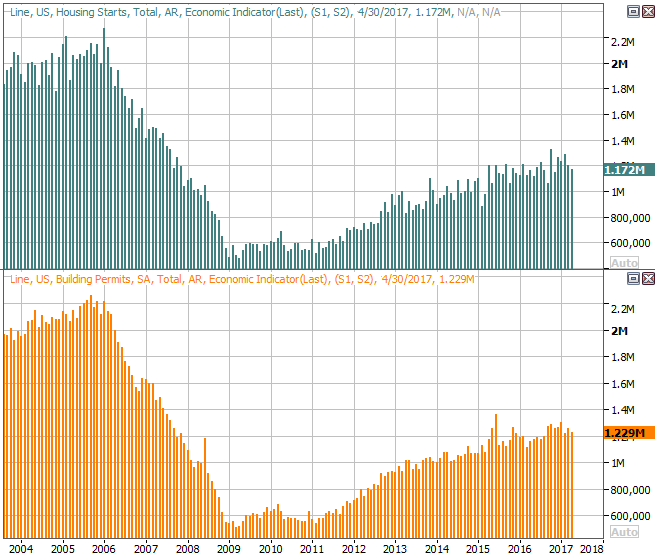
Source: Thomson Reuters
It's too soon to sound the alarm bells just yet. As you can see on the chart above, the broad trend is still a bullish one. On the other hand, this should be something investors keep a close eye on in the immediate future. Though not much else (like oil, industry, jobs, etc.) had been doing a whole lot to keep the economic engine revving, at least the construction market was a bright spot, pulling everything else along. Now that bright spot could be fading.
That said, while starts and permits may be waning, that lull appears to be offset by a much-need improvement in the nation's factory activity. The Federal Reserve's Industrial Production Index grew 1.0% (the biggest advance in quite some time), and the capacity utilization rate advance to 76.7% (which was also the best rate we've seen in over a year). Clearly this is a significant change in character for these mostly-tepid-of-late levels, hitting the throttle on what's been a rather shallow recovery until now.
Industrial Production and Capacity Utilization Charts
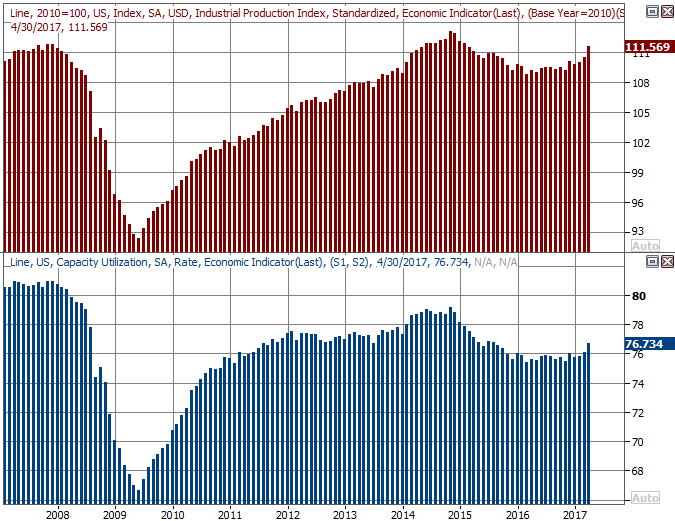
Source: Thomson Reuters
Like his politics or not, last month's industrial production surge is largely attributable to President Trump's America-First agenda.
Everything else is on the grid.
Economic Calendar
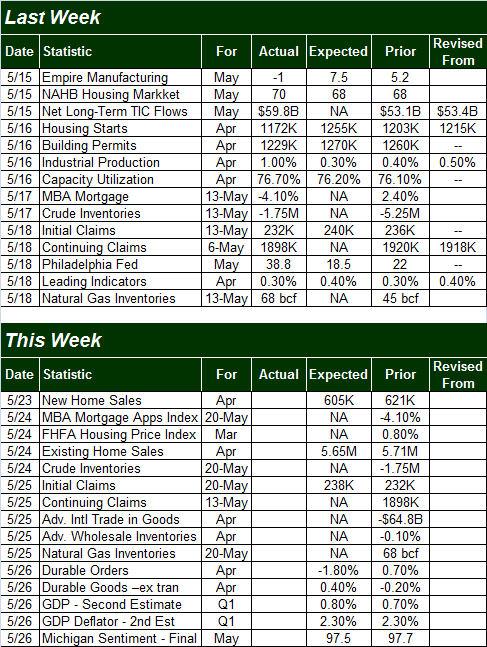
Source: Briefing.com
We'll be getting a fair amount of economic news this week as well, but once again, not much of it is terribly interesting to us.
One of the items we will be watching closely is Tuesday's new home sales, followed by Wednesday's existing home sales report for April. It'll be interesting to see if they see the same headwind starts and permits did. As it stands right now, economists think both of them will.
New, Existing Home Sales (With Inventory Levels) Charts
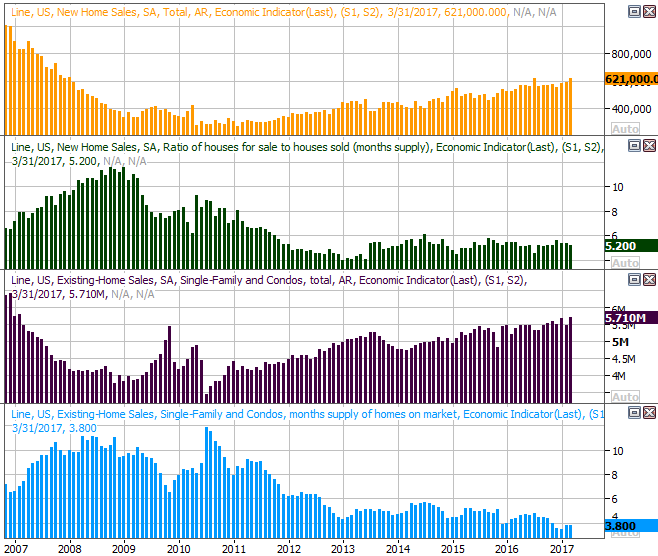
Source: Thomson Reuters
As was the case with housing starts and building permits, one slow month of home sales won't indicate a looming implosion. It will, however, call for investors to keep a closer eye on the data going forward.
The other data set we'll be watching closely is the durable goods orders report for April. Though expected to be down overall -- to the tune of 1.8% -- when stripping volatile transportation orders from the mix, they're expected to grow 0.4%. That's a nice turnaround from March's 0.2% slide.
Durable Goods Orders (with and without transportation) Charts
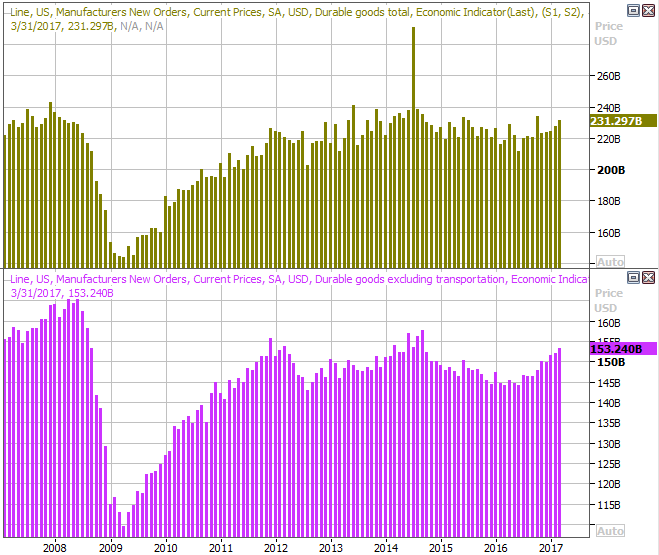
Source: Thomson Reuters
The Michigan Sentiment Index and the 2nd estimate of Q1's GDP growth, though interesting, aren't apt to be market-moving (barring a wide swing from their previous estimates).
Index Analysis
The market may have ended last week on a bullish foot, but don't read too much into it. Though Friday was bullish, the bulls were actually peeling back from the technical hurdle they needed to clear by the time the closing bell rang.
This is readily evident on the daily chart of the S&P 500 below. After bumping into the 20-day moving average line at 2389 on Friday, the buying effort faded to a close of 2381.73. And, we can now see that while the buyback volume wasn't bad, it certainly wasn't decisively good. We would have expected a stronger buy-in if traders were committed to the bigger-picture rally (and certain that Wednesday was just a fluke).
S&P 500 Daily Chart
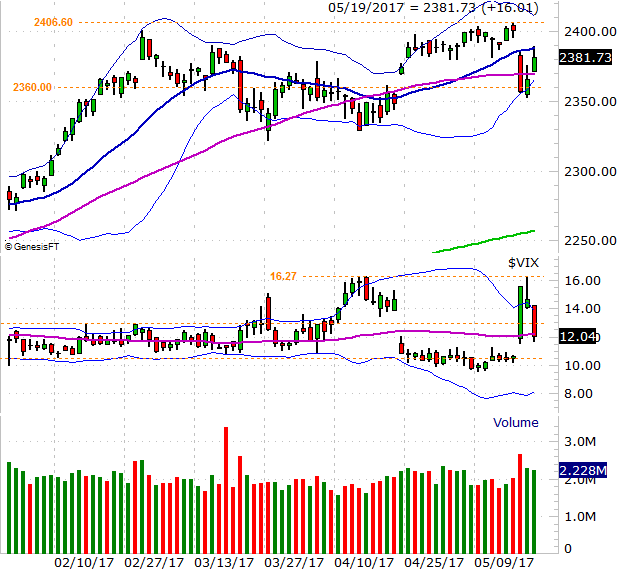
Chart created with TradeNavigator
It's also interesting that the VIX fell all the way back to its 50-day moving average line, but no farther.
Maybe the VIX just wasn't in a good position to fall any farther. Maybe it was all the bulls could do to get the S&P 500 to 2381.73 after the severe beat-down on Wednesday; a lot of people were still shell-shocked. Indeed, maybe the biggest purpose of Wednesday's drubbing was to go back and fill in the gap left behind on April 24th. [We now have a gap between 2384.87 and 2396.05, by the way, bolstering the bullish argument.]
Or, maybe Thursday's and Friday's action was nothing more than the dead-cat bounce it looks like it was, leaving the door open to more downside now that the initial shock is fading.
Flipping to a daily chart of the NASDAQ Composite doesn't help us sort it out any better. Although the composite cleared its 20-day moving average line briefly on Friday, once it bumped into minor resistance at 6102, it peeled back as well. And like the VIX, the VXN bumped into its previously-established ceiling formed in April and started to slide... yet isn't back in a convincing downtrend.
NASDAQ Composite Daily Chart
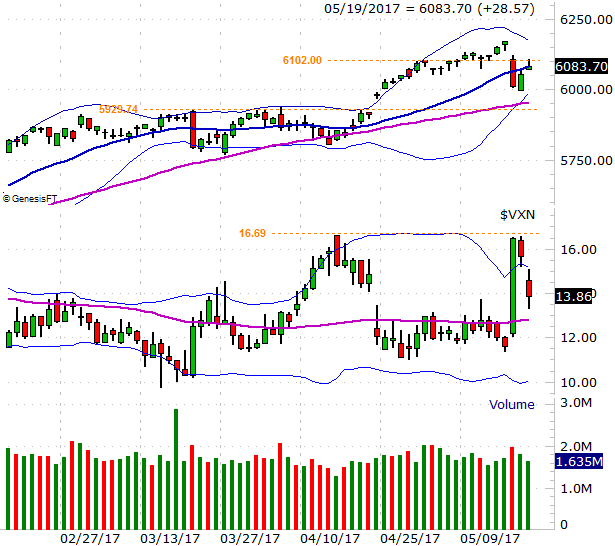
Chart created with TradeNavigator
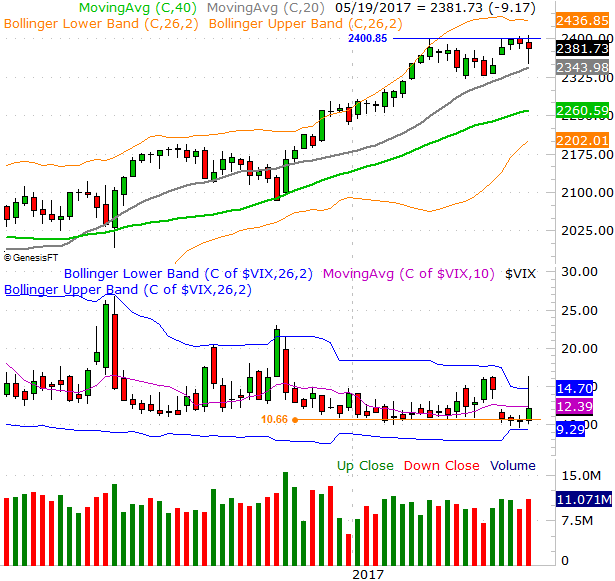
With all of that being said, zooming out to a weekly chart of the S&P 500 may not help us get a better bead on the market's direction here, but it sure does tell us how and why we're still here. It's in this timeframe it becomes clear the S&P 500 is having trouble with a ceiling right around 2400, and the VIX can't really move under 10.6. That augments the resistance the S&P 500 is facing here.
S&P 500 Weekly Chart
Chart created with TradeNavigator
It's this same weekly chart, however, that makes it clear where the lines in the sand are... and they're further apart than we'd normally expect to see them.
If the S&P 500 breaks below 2326.6 and/or the VIX breaks above 16.4, the tide will have turned bearish. That will be more damage than even the staunchest of bulls can withstand.
Conversely, if somehow the VIX manages to break under 10.6 and the S&P 500 musters a thrust above 2400, that will likely be interpreted as the beginning of another bullish leg. Be careful about digging in too deep in such a scenario though. The market is facing pretty significant valuation problems here, and as the weekly chart also shows, we've gone a little too long without a significant correction. The last part of May is also when the "Sell in May" effect really starts to kick in.
Bottom line: While it's usually more fruitful to be out in front of other traders, in our current situation, the smart thing to do is let everyone play their cards first. There's more-than-usual risk in being wrong about the market at this time.