

The market recovered well from the prior week’s concerning weakness… then never stopped recovering. The S&P 500 kept on climbing once it made a bullish intraday reversal on Monday. When all was said and done, the index gained 3.4% last week to close just under a new record high. The NASDAQ Composite did the same. Both have room and reason to continue running as well.
That doesn’t mean the bulls will only have smooth sailing in the immediate future. There’s still plenty of potential for stocks to get rattled, like lingering geopolitical tensions in the Middle East. But, the undertow is most definitely moving in a bullish direction.
We’ll explore the matter in some detail in a moment. Let’s first look at last week’s biggest economic announcements and then preview what’s coming this week.
Economic Data Analysis
Truth be told, while the market did well enough last week, it’s not as if the economy is so rock-solid that traders had no choice but to be buyers. There are still plenty of red flags waving.
Take the real estate market as an example. Although the Case-Shiller index extended its recently-rekindled uptrend in April (not May), the FHFA Home Price Index hastened its slow rollover from its peak in March.
Home Price Charts 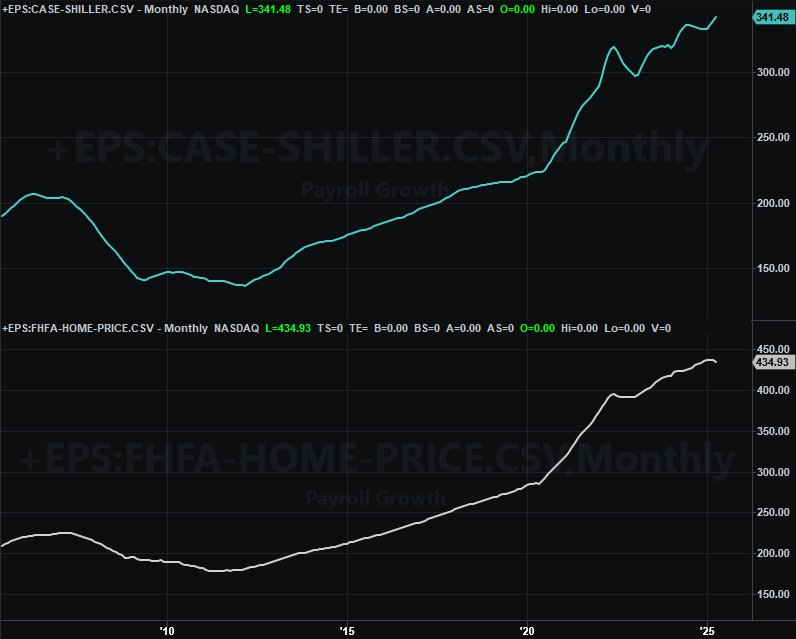
Source: FHFA, Standard & Poor’s, TradeStation
This mixed message has at least a partial explanation. It’s possible that FHFA-eligible homebuyers aren’t using this loan program as much simply because prices are so high that many homes are no longer eligible for such loans. This of course would underscore the idea that there’s a firm dividing line between the higher-end and lower-end markets, with a fresh divergence between the two.
And other real estate data at least somewhat says things remain relatively weak. While sales of existing homes edged just a little higher in May after a couple of months’ worth of weakness, that was a just-barely move. Meanwhile, sales of new homes tumbled back to near the lowest levels seen since we finally started to ease out of the pandemic.
New, Existing Home Sales Charts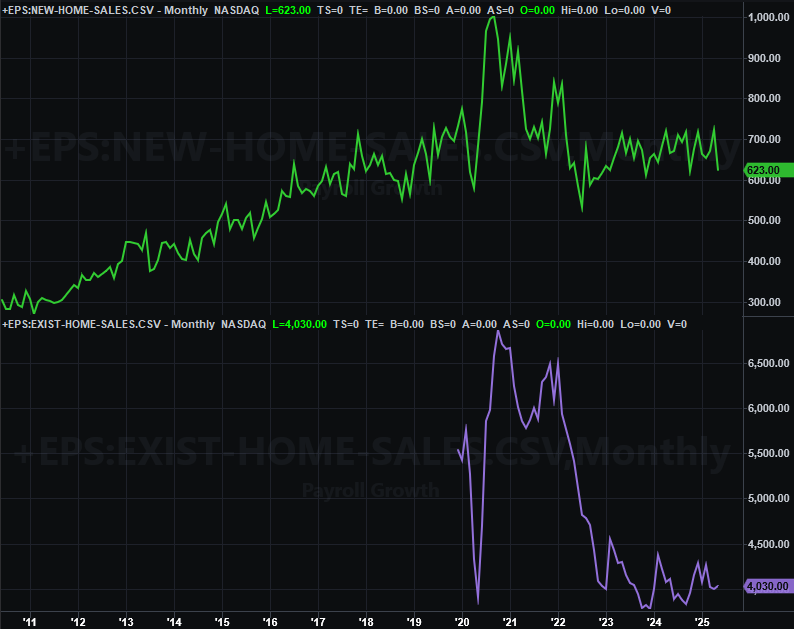
Source: National Assn. of Realtors, Census Bureau, TradeStation
Both of these data sets -- alone or together -- of course confirm that demand for residential real estate remains quite weak at current prices. Sellers are actually pretty lucky to be getting the prices they want. That being said, even this may not be the case for much longer. Inventory continues to grow from 2022’s trough, reaching a multiyear high of 1.036 million as of May.
We’re also getting mixed messages on the sentiment front. Although neither of June’s final reading are plotted on the chart below, the Conference Board’s consumer confidence score fell from 98.0 to 93.0 this month, while the University of Michigan’s consumer sentiment reading for this month bounced from May’s low of 52.2 to 60.7. Both are still at or near very low levels, however.
Consumer Sentiment Charts 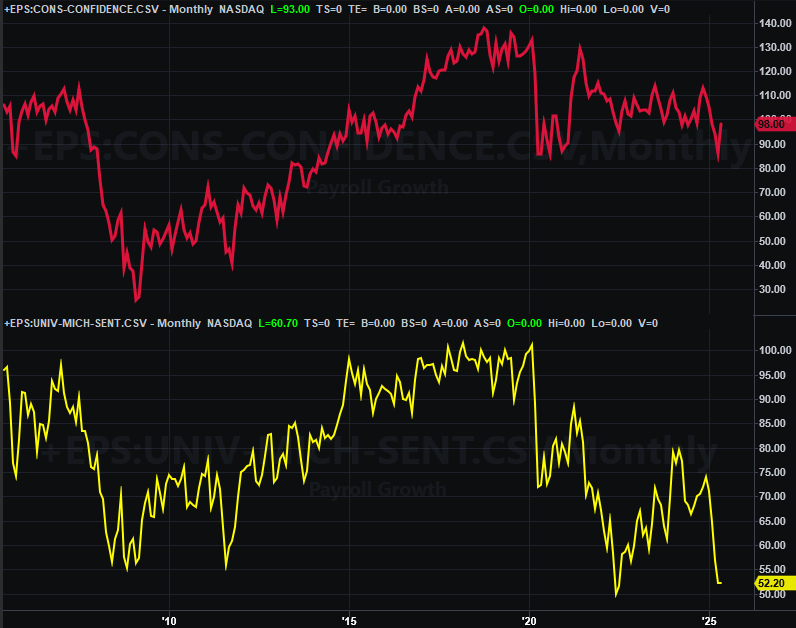
Source: Conference Board, University of Michigan, TradeStation
This is alarming on the surface, and perhaps investors should be worried. There’s an arguable contrariant interpretation of this sentiment data though. That is, all this doubt sets the stage for a turnaround that nobody sees coming.
Other numbers released last week that we’re not going to bother charting here are last month’s personal income and spending, and the second (of three) Q1 GDP estimates. Income as well as spending unexpectedly fell following April’s forward progress, giving the Federal Reserve a bunch more room to lower interest rates if need be. The revision to the first quarter’s GDP growth does the same. The Bureau of Economic Analysis says the country’s economic activity fell 0.5% in Q1, down from the first guess of a 0.2% dip, and much worse than the 0.2% growth economists were expecting in the revision.
Everything else is on the grid.
Economic Data Report Calendar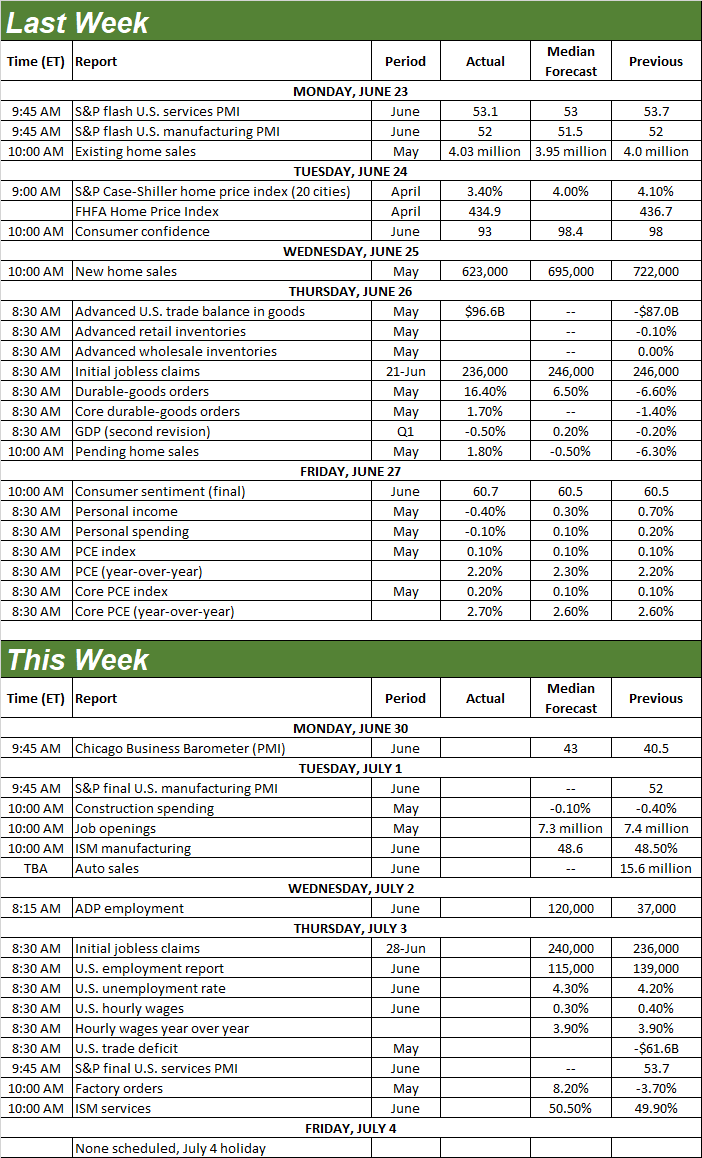
Source: Briefing.com, TradeStation
This week isn’t going to be as busy. It’s also going to be shortened by the 4th of July holiday on Friday. The only items of any real interest will be Tuesday’s look at the Institute of Supply Management’s measure of manufacturing activity, followed by Thursday’s report in the nation’s services activity. Economists are looking a slight improvement from each one. Both remain relatively lackluster though.
ISM Services, Manufacturing Index Charts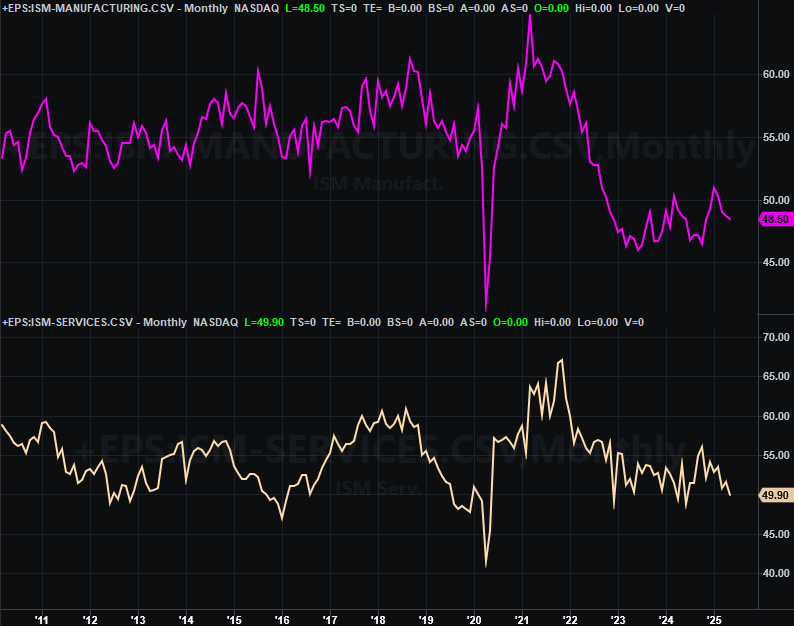
Source: Institute of Supply Management, TradeStation
Stock Market Index Analysis
Getting straight to the point, the bulls pushed up and off important technical support last week right out of the gate, and never looked back. It was enough to take stocks to record highs, in fact.
Take a look at the daily chart of the S&P 500 below. The technical floor in question is the 20-day moving average line (blue) at 6,015. It was under pressure as of the end of the previous week, leaving the market hanging by a thread. Then everything changed coming back from the weekend. The index made good persistent progress all week long, gaining 3.4% for the five-day stretch to push past its prior peak at 6,147, reached in February. Friday’s close at 6,173.07 is a new record for the S&P 500.
S&P 500 Daily Chart, with VIX and Volume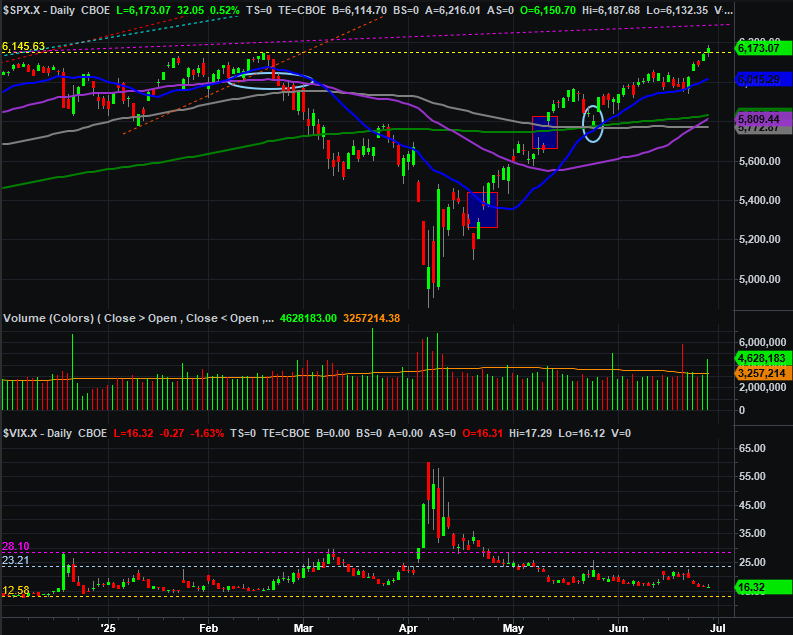
Source: TradeNavigator
And the effort is even healthier than it may seem on the surface. Look in the middle of the chart at the index’s daily volume. The bulls were puling in en masse with Friday’s rally, choosing to load-up headed into the weekend rather than defensively scaling out. This implies strong confidence that the market can and will continue rallying.
The NASDAQ Composite’s daily chart looks about the same, racing to a record high on Friday after bouncing off of its 20-day line it hit on Monday and the prior Friday. And like the S&P 500, there was strong volume behind Friday’s game-changing gain. The only additional detail worth noting here is that the composite also poked above the falling technical resistance line (orange, dashed) that had halted its advance a few times since December’s peak (red arrows).
NASDAQ Composite Daily Chart, with VXN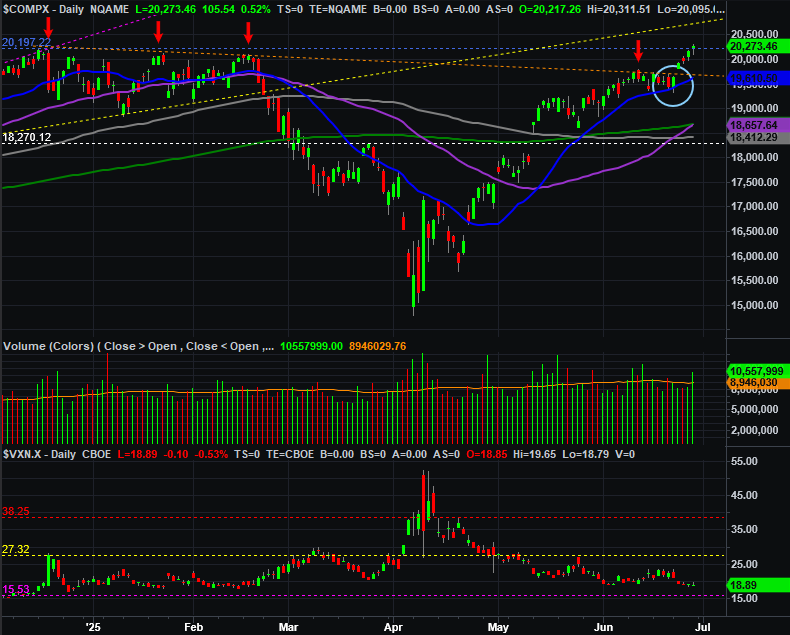
Source: TradeNavigator
Here’s the weekly chart of the S&P 500 to put last week’s advance in perspective. It was clearly a sizeable move, and there’s no denying the past twelve weeks have been incredibly -- and even oddly -- bullish. Even so, that’s only been an unwinding of an equally-rapid selloff in February and March. The big rally since mid-April doesn’t even yet put the market back in its long-term bullish channel (framed by dashed lines on the weekly chart below) that’s been established since 2023.
S&P 500 Weekly Chart, with VIX 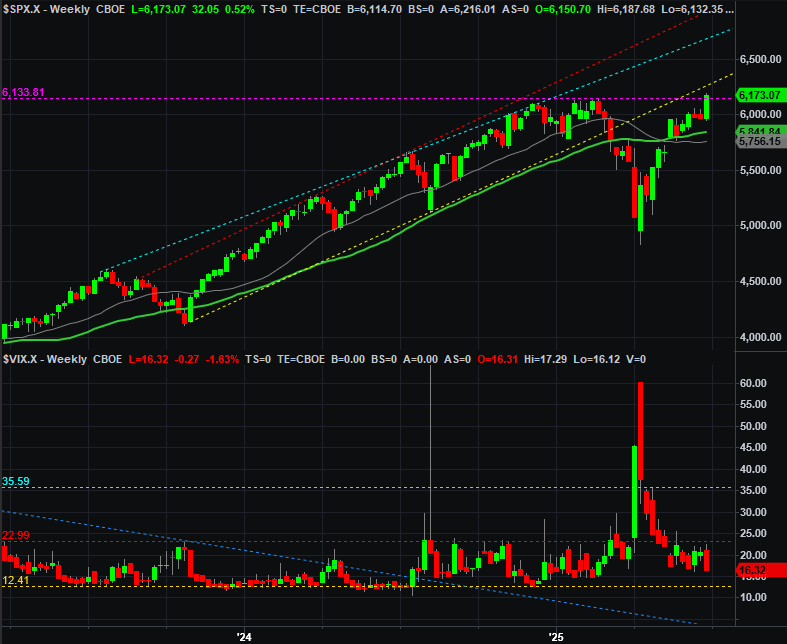
Source: TradeNavigator
The NASDAQ Composite, by the way, has moved back into the middle of its equivalent rising bullish channel, demonstrating what’s possible, and what the S&P 500 may be ready to do for itself.
NASDAQ Composite Weekly Chart, with VXN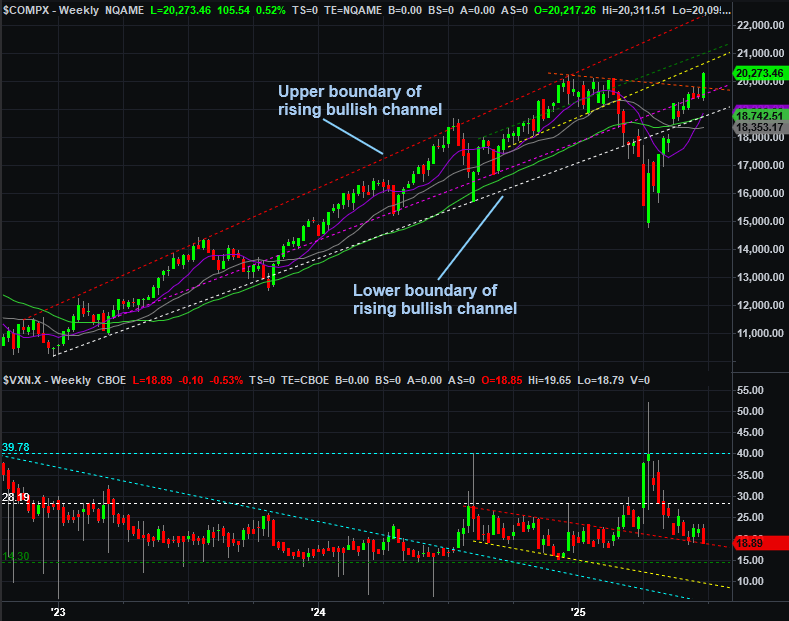
Source: TradeNavigator
That doesn’t mean the market is guaranteed to keep ripping higher straightaway from here. It can be -- and likely will be -- be tested at least a little bit from here. Just don’t panic if this bullishness falters just a little bit while the bulls catch their breath. There’s room for a little bit of a pullback without breaking the bigger-picture uptrend. As long as the S&P 500 remains above its convergence of several moving average lines around 5,810, the trend will technically be leaning in a bullish direction. Such a dip would actually be a buying opportunity, in fact, as long as the economic and geopolitical backdrop remain reasonably positive.