Weekly Market Outlook - A Far-From-Perfect Recovery Effort
 It was a recovery effort to be sure, but hardly the one investors truly wanted to see. Inspired mostly by headlines and unfurling on increasingly tepid volume, the bulls' true conviction remains unclear. This is what the bears' perfect headfake would look like.
Whatever's in the cards, odds are good we're going to see some sort of pullback no matter what. The S&P 500's 4.4% gain last week is too much, too soon, and the effort started to falter at a familiar line in the sand. It's likely the bulls and the bears will try to regroup early this week. Then we'll see what's really in store.
The nice part is, the make-or-break lines are pretty easy to make out.
We'll dissect it all below, but first, a rundown of last week's big economic announcements and a preview of this week's economic news.
Economic Data Analysis
Last week's highlight, of course, was Friday's employment report for May. There were several other reports worth a look that came before the jobs figure did though, beginning with Monday's ISM Manufacturing data. Though still above the critical 50 level, it fell from 52.8 to 52.1. The ISM Services index, however, improved from 55.5 to 56.9, counteracting the lull on the manufacturing side of the table.
ISM Manufacturing, Services Index Chart
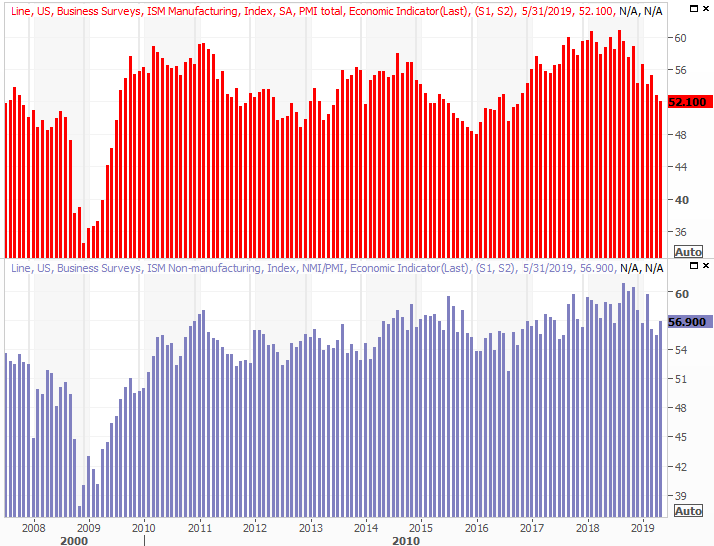
Source: Thomson Reuters
Also on Monday we heard May's auto sales figures. Passenger car sales were flat once again, at a pace of 3.52 million, though truck sales perked up from April's reading of 9.2 million to 9.92 million.
Automobile Sales Chart
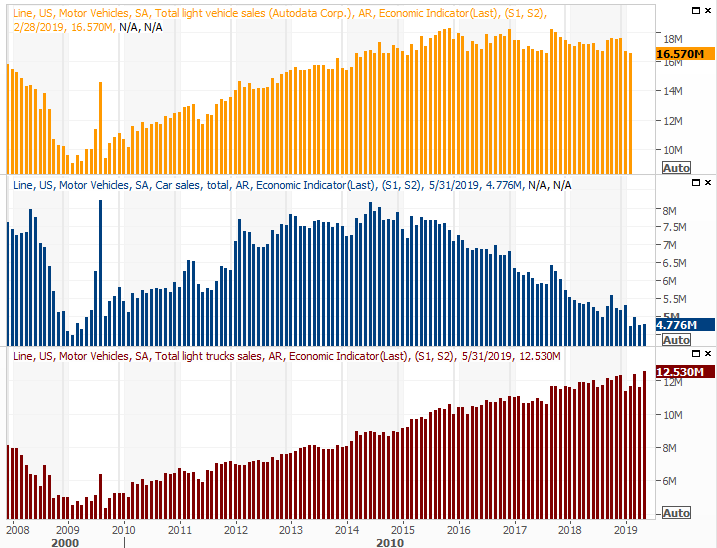
Source: Thomson Reuters
They're still lackluster in the grand scheme of things, but it's a little progress where we desperately need some. Somehow though, the bigger tide still feels like it's moving in the wrong direction, not because consumers can't afford a new vehicle, but because they just don't need one yet.
Underscoring that idea is Friday's jobs report. The U.S. economy only added 75,000 non-farm payrolls, but with the unemployment rate remaining at a multi-year low of 3.6%, the problem isn't a lack of jobs. It's a lack of workers willing to accept or switch jobs.
Payroll Growth, Unemployment Rate Chart
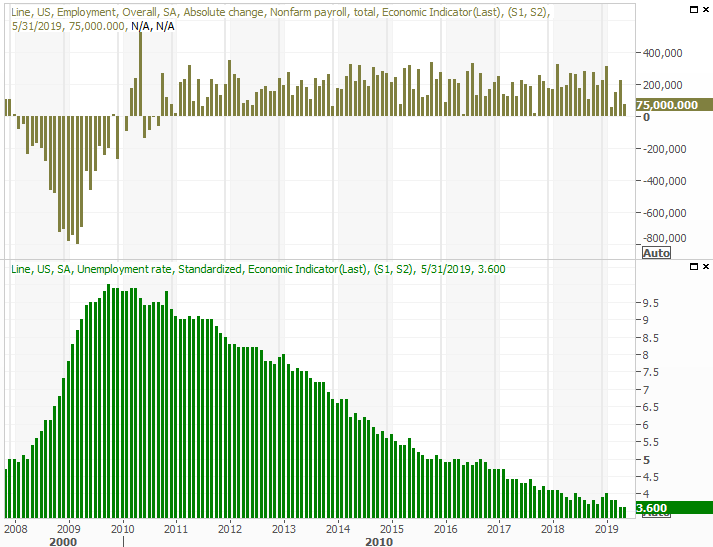
Source: Thomson Reuters
The deeper look at the jobs report we posted at the sight confirms the idea. Wages are up, even if not at breakneck speeds. And, the total number of people with jobs is back to growth while the total number of people without jobs remains in a downtrend.
All things considered, given the headwind created by a tough tariff war, the jobs market is about as healthy as it could feasibly be. Anything else could spur the very inflation most consumers and investors say they don't want.
Read all the details here: https://www.bigtrends.com/stocks/may-jobs-report-was-healthier-than-headlines-suggested/
Everything else is on the grid.
Economic Calendar
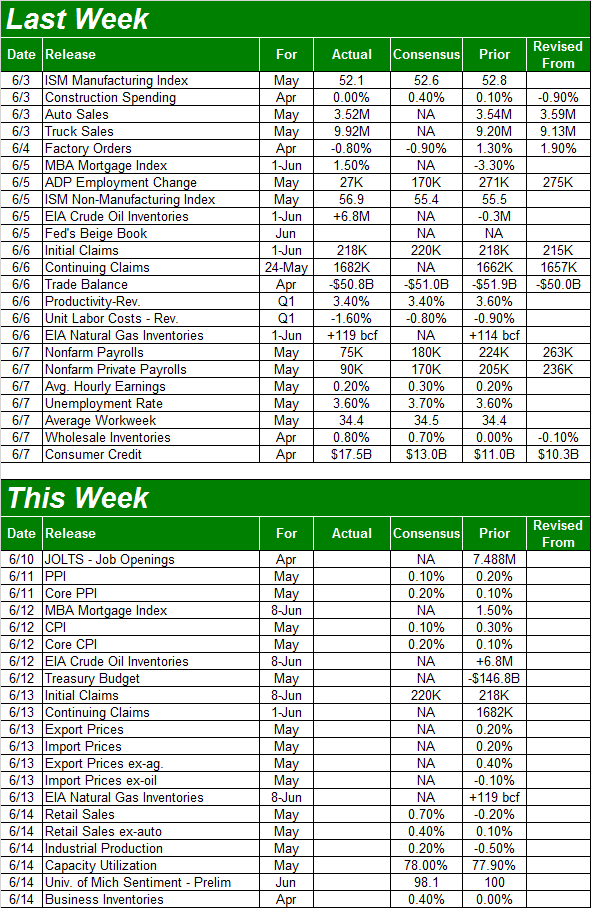
Source: Briefing.com
This week's biggies are inflation, retail sales and last month's factory activity.
The inflation picture starts being drawn on Tuesday, with the producer inflation report. It will be complete on Wednesday with the consumer inflation data. Both have been tame, giving the Fed plenty of wiggle room. But, economists are calling for even more tempered inflation this time around... possibly reflecting a slowdown on the jobs front (a slowdown in the pace of forward progress).
Consumer, Producer Inflation Charts

Source: Thomson Reuters
On Friday look for last month's retail sales figures.
You'll recall retail spending has been choppy of late, weak more often than not. Economists are calling for a pretty strong May, but they've been calling for strong spending for most months this year. They've not usually gotten it.
Retail Spending Charts
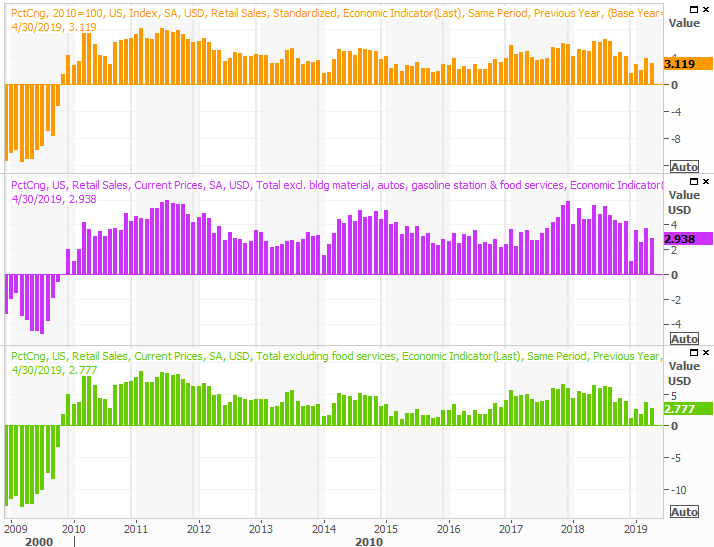
Source: Thomson Reuters
Finally, also on Friday look for the Federal Reserve's report on industrial output and capacity utilization.
You'll recall this data coincides very well with the long-term market trend and corporate earnings. You may also recall recent reports have been increasingly worse, painting a problematic picture. The pros are calling for a modest improvement in May's data, and we desperately need it.
Capacity Utilization, Industrial Productivity Charts
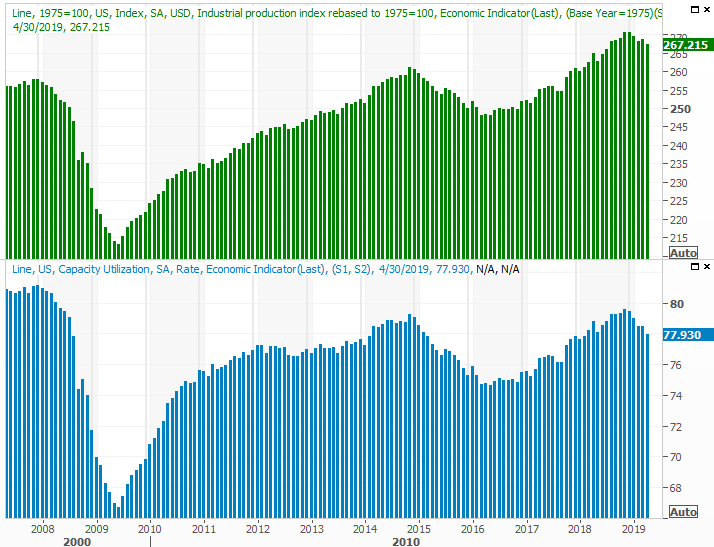
Source: Thomson Reuters
Stock Market Index Analysis
It was a good week, but not the perfect recovery effort. Namely, as the closing bell approached on Friday, the bulls were starting to back off. The S&P 500 still managed to close above its 50-day moving average line, but just barely. It's also curious that the VIX pushed a little higher on Friday.
S&P 500 Daily Chart, with VIX, Volume
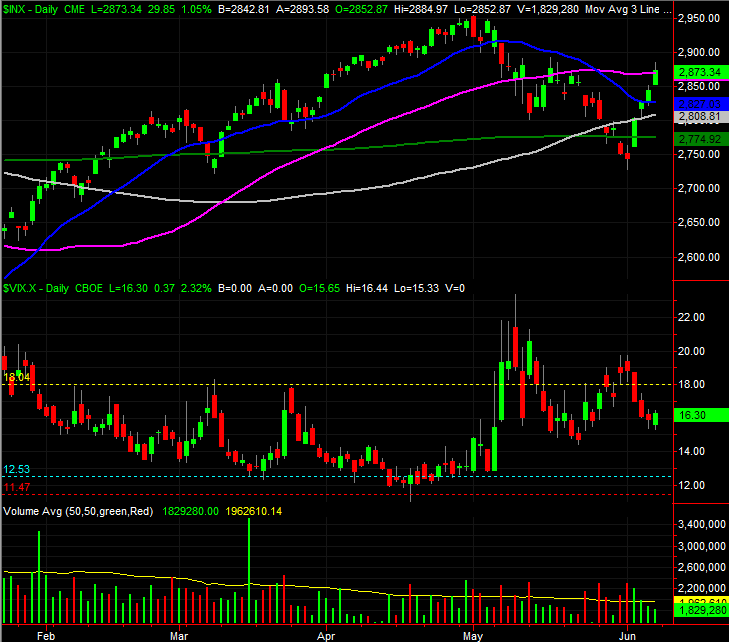
Source: TradeStation
Most noteworthy of all, however, is the way the daily volume continued to fade as the rally wore on. This effort doesn't have very many backers or participants.
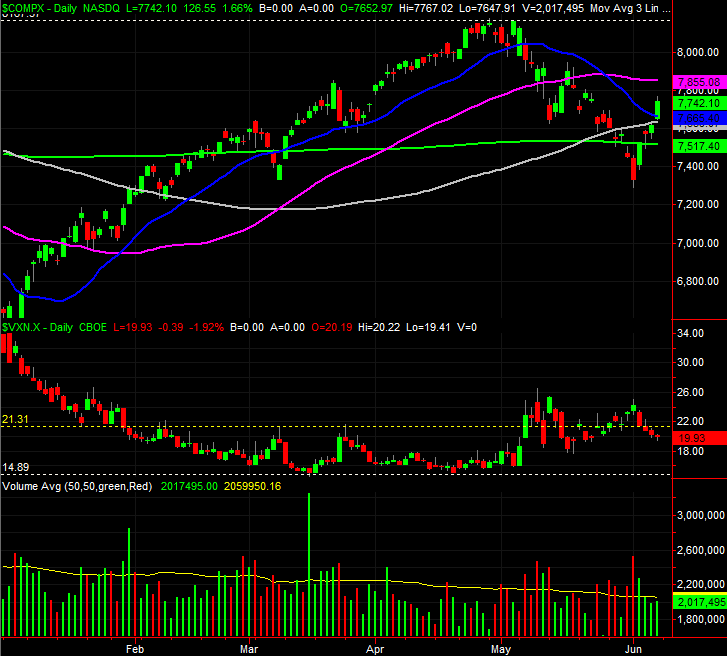
The daily chart of the NASDAQ Composite tells the same basic story.
NASDAQ Composite Daily Chart, with VXN, Volume
Source: TradeStation
Zooming out to the weekly chart of the S&P 500, unlike usual, offers some important perspective. Namely, it makes clear that last week's gain wasn't just big, but the biggest weekly gain we've seen since November. But - and the is the alarming part - the November gain ended up being a setup for a huge meltdown... just after a whole slew of people convinced themselves a relatively modest pullback was ready to come to a close.
S&P 500 Weekly Chart, with Volume

Source: TradeStation
That's not to suggest that has to be the outcome this time around. It would be reckless, however, to ignore that distinct possibility this time around... particularly given the lack of volume behind the move.
Fortunately, all of this is taking shape near the critical moving average lines. The bulls and the bears will both get a chance to regroup here, and the moving averages should mark when and where either side of the table begins a more prolonged move. The 200-day moving average line, marked in green, is the key floor. At the other end of the spectrum is the aforementioned 50-day moving average line, plotted in purple, which turned into something of a ceiling on Friday.
The VIX, of course, is also on the radar.
We suspect this week will start off with some profit-taking, but don't take it to heart. Unless the 200-day line fails as support, the market will remain on the fence.
At the other end of the spectrum, should stocks continue to make progress, that's actually more problematic than doing nothing in that it sets the stage for even more pronounced profit-taking... the kind of profit-taking that could put traders into a prolonged panic mode that ends up crushing the market anyway.
In other words, the most bullish thing that could happen this week is actually a modest cooling that lets the bulls regroup and rethink.
The VIX is still a big barometer. The 18.0 level is the VIX's make-or-break mark.