Virgin Galactic Could Fall Another 15%. Chart Shows Where to Buy Dip.

-- Virgin Galactic stock had verged on a breakout. Now it's dropping. Here's where we're looking to buy the dip. --
By Bret Kenwell, TheStreet.com
Shares of Virgin Galactic (SPCE) are under pressure on Friday amid gains in the broader stock market.
While the S&P 500 works on its third straight day of gains, Virgin Galactic is getting hammered and has been since the premarket session.
Last night, the company said it would delay its next flight.
Specifically, the company said it planned to delay its commercial flights into 2022, saying, "given the time required for this effort, the company has determined the most efficient and expedient path to commercial service is to complete this work now in parallel with the planned enhancement program."
As a result, Bank of America analysts lowered their price target to $20 from $25.
The stock is near that level now. Is the selling pressure nearing an end? The charts say there could be more downside.
Trading Virgin Galactic Stock
Daily chart of Virgin Galactic stock
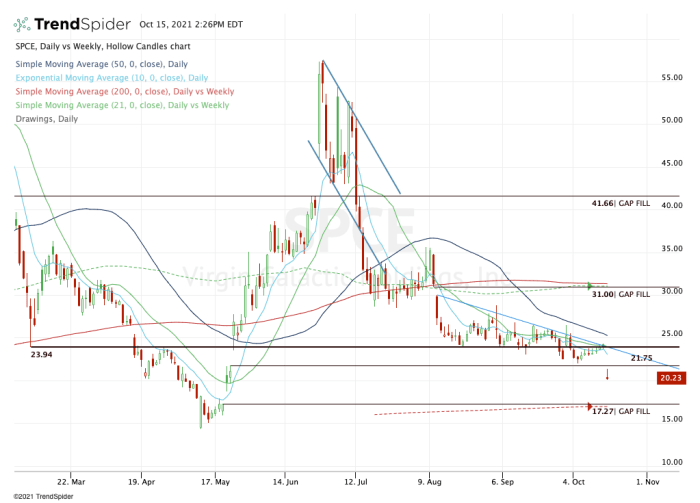
Chart courtesy of Virgin Galactic stock
Virgin Galactic stock bottomed in early May, right when the bear market in growth stocks was coming to an end.
From there the shares exploded higher, climbing in nine of 10 sessions. Amid the run, it left two massive gap-fill levels. One was at $21.75. The other was at $17.27.
Today's action resulted in another massive gap, this time to the downside. It also came right at the key $24 level, along with the 21-day moving average and downtrend resistance (blue line).
Obviously the technicals didn't cause Friday's dip, but they certainly didn't help. On the flip side, a move higher could have triggered a notable breakout. But alas, that's not the development we're seeing today.
The stock opened near $20, rallied up toward the first gap-fill level near $21.75 and faded hard.
If Virgin Galactic stock loses $20 and closes below it, it opens the door to the second gap-fill level at $17.27.
As bad as it would look, I'd love a dip down to this area. The risk/reward balancefor a dip-buy would be quite reasonable, particularly with the 200-week moving average in play near this area as well.
If it gets there, it will represent a decline of roughly 15% from current levels. Let's give this one some time and see if we get a more advantageous buying opportunity.
From TheStreet.com