TRIN Arms Index Spotted the Market Headwind, Still Warns of Potential Short-Term Bearishness
Advance/Decline Line & Up/Down Volume Is A Concern For Broad Market
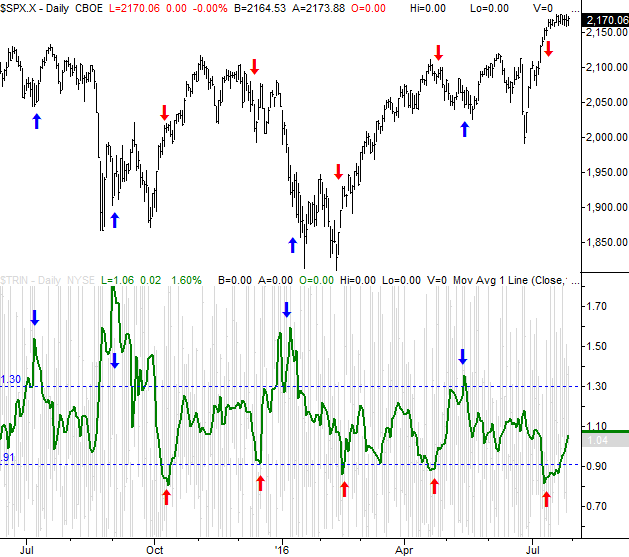
A couple of weeks ago we looked at the NYSE's Arms Index, or Trading Index (often called TRIN, for short), concluding it warned us the market's rally wasn't particularly well-positioned to last. Since then, the S&P 500 (SPX) (SPY) has gone -- literally -- nowhere, remaining at the same value of 2161 it was at then. Like clockwork, the NYSE Up-volume and down-volume as well as the NYSE's advancers and decliners have all moved in a negative direction, as the Arms Index suggested would be the case. The chart is worth a closer look today, simply because the TRIN or Arms Index is not yet back to an extreme that would suggest decided bullishness is around the corner.
As a refresher, the Trading Index [and each exchange has one] is a ratio of ratios. It's calculated by dividing the advancer/decliner ratio by the Up-volume/Down-volume ratio. Ideally, it would always be 1.0, meaning a big rally would be similarly supported by big volume, or conversely, a big selloff would be similarly supported by a similar degree of volume. When the Arms Index deviates from the 1.0 level we know a breakout or a breakout is doomed because it doesn't have the participation, or volume, it needs.
It's not a perfect tool, but when used in conjunction with other tools it's quite helpful in spotting the market's unsustainable extremes.
As was the case with the last look, the extreme bullish readings for the NYSE TRIN are marked with blue arrows -- when the Arms Index is above 1.3 -- while the extreme bearish readings -- when the Arms Index is below 0.90 -- are marked with red arrows. Though the bearish warning from two weeks ago has yet to bear fruit, it's noteworthy the market has been unable to advance since then.
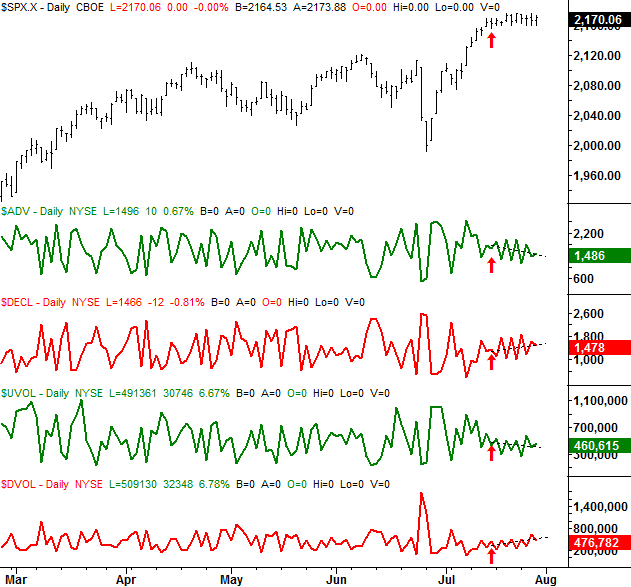
When we break the four components of the NYSE's Trading Index down, we can largely see what we'd expect. That is, the number of decliners is rising, as is the down volume. Conversely, the number of advancers is falling, as is the bullish volume. None are in straight-line trends, but the bigger trend is clear.
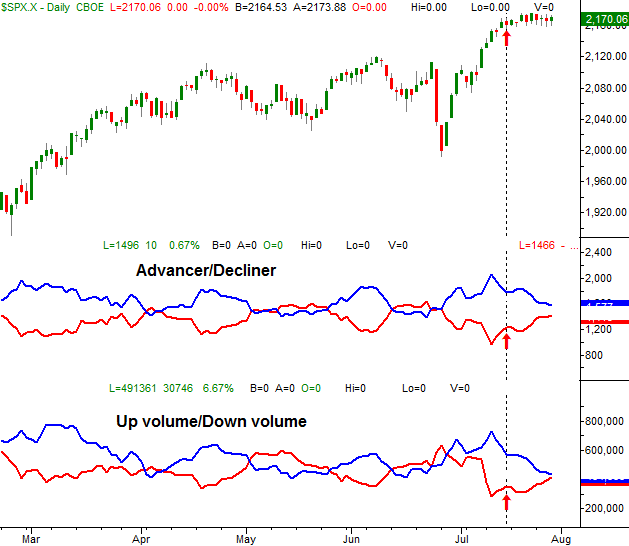
We can make even more sense of the advancer/decliners and up/down volume by looking past them and instead plotting their moving average lines. On the chart below we've overlaid the advancer average (blue) with the decliner average (red), and overlaid the up-volume average (blue) with the down-volume average (red).
These new trends are the reason the Arms Index has since moved back to a reading of 1.05, where things are considerably more balanced. It's possible this balance may be enough to let the broad market start rallying again. More often than not though, a really good rally needs a TRIN reading of above 1.3 to get going in earnest. The Arms Index's current reading of 1.05 may be a transitory one, en route to higher levels. If that's the case, the S&P 500 may still need to edge lower first before moving higher again as the advancers/decliners and up/down volume continue their swing back from extreme levels seen two weeks ago.
As was noted in mid-July, the Arms Index as a trading tool isn't without its flaws. It doesn't necessarily indicate when a trend might reverse, and it doesn't do much good unless it's at an extreme (> 1.3, or < 0.9) level. Nonetheless, more often than not it identifies roughly where the turns within a choppy, range-bound market should be happening. It certainly recognized when the late-June/early-July rally was running out of gas. And, as long as it's rising, it's still warning us of a pullback.