The recent upside breakout seen in the US Transportation Index is a very important signal for traders. Our research team has been following these moves for many months and we believe the recent upside breakout in the $TRAN is a strong sign of future US Equities price moves and all traders should be paying very close attention.
The Transportation Index typically leads the US Equities markets by about 3 to 6 months. Transportation is one of the core elements of economic activity. Items entering the US or distributed throughout the US must rely on transportation to ship/deliver these goods to resellers, wholesalers, and ports. When the Transportation Index rises, one should expect the economic activity to continue to increase.
Given that we are only three months from the Christmas holiday season and understanding that retailers, wholesalers, and warehouses have likely already been stocking up on the holiday items, it makes sense that the Transportation Index would have been climbing over the past few months. Remember, the Transportation Index leads equities by about 3 to 6 months. So, we would have expected the Transportation Index to rally about 6 months before December if the economy was strengthening.
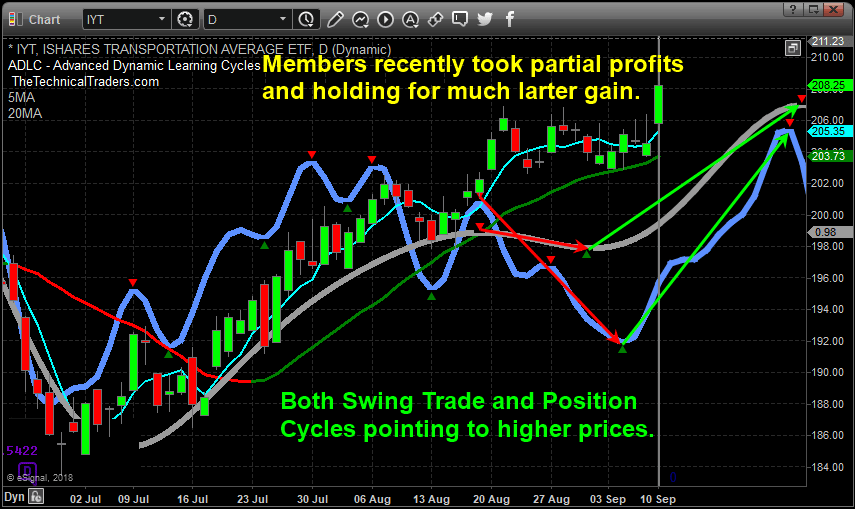
The breakout rally currently exhibited in the Transportation Index paints a picture that many may not be aware of for early 2019. Should the Transportation Index rally continue into October or November, or possibly longer, this would indicate that the US Equities market could continue to rally well into March or April of 2019 – possibly much longer. This means traders looking for a massive top any time soon, or big short sellers could have some big soling positions as this rally continues for the next 6+ months. While many are bearish on stocks and short the market, we remain long IYT with our position with members.
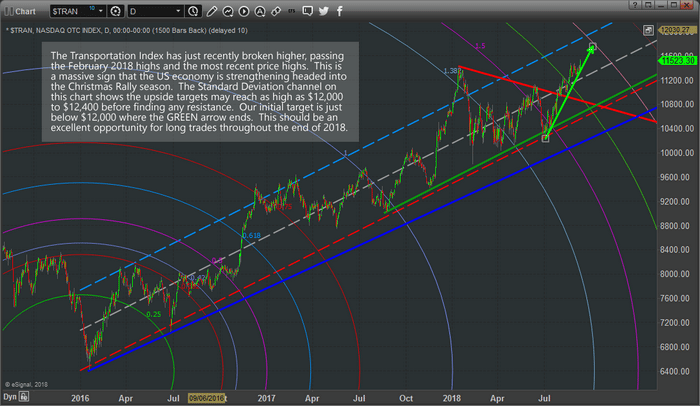
Let’s take a look at another chart. This Daily Transportation Index chart is very long term as we wanted to clearly illustrate the Standard Deviation channel that is in place going all the way back to 2016. The DASHED lines on the chart represent the Standard Deviation channel range that is likely to continue to operate as a price boundary going forward. The ARCs that appear on the chart are a unique tool we use to measure Fibonacci price acceleration and ranges. The upside price breakout points to an upside target of near $11,800 to $12,00 very quickly. From this level, we expect a bit of price rotation before another upside leg begins.
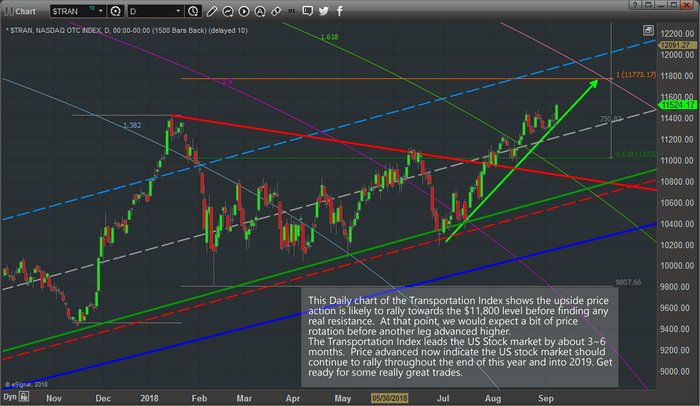
This next chart is the same Daily Transportation Index chart, just a closer view of the most recent 10+ months of price data. We can still see the Standard Deviation channel ranges and the upside breakout highlighted by our GREEN arrow. We’ve also added a Fibonacci price extension tool based on recent price rotation that points to an $11,773 upside target. We see confluence in multiple analysis techniques when multiple studies point to the same outcome. In this case, the Fibonacci Arcs, Fibonacci extensions and Standard Deviation channel all support the continued rally to near $11,800 for the Transportation Index.
As traders, this should be a very interesting and rewarding “look into the future” for many of you. These charts are suggesting the US Equities markets may continue to push much higher well into early 2019. As long as this upside trend in the Transportation Index continues, we should continue to expect a strengthening US economy, stronger economic and GDP levels and stronger consumer activities. In other words, get ready for some great long trades over the next few months and get ready to pick apart these opportunities as they play out.
Our team or researchers and professionals have been long the Transportation index for many weeks now. We identified this move months ago and alerted our followers to get into this trade early. If you want to know what our team of professional traders are telling our members now and how to find great opportunities throughout this move, visit www.TheTechnicalTraders.com to learn more.
Chris Vermeulen