Trading Stocks After the Election: Breakout or Pullback?
- It's been a busy week for the bulls, as the S&P 500 works on its fifth straight weekly gain. Are stocks a buy after the election? -
By Bret Kenwell, TheStreet.com
What a week it has been in the stock market, given that the presidential vote count has dragged out for multiple days.
If you're trading and made money this week, take a minute to pat yourself on the back for a job well done. If you lost money trading, take a moment to cut yourself some slack on what was a tricky event and look to pick up some lessons from it.
Coming into this week, the S&P 500 and Nasdaq were coming off a higher low in October.
Stocks had rallied to highs in September before selling off later in the month. In October, the market rallied again but couldn't retest its highs before another dip ahead of the election.
That left investors with mixed feelings ahead of this week, which featured the election on Tuesday and the monthly jobs report on Friday.
With the vote count dragging on, the market continues to hold onto its recent gains.
Some investors are scratching their heads as to why, but if all the market craves is certainty, then the election results must seem pretty clear to it despite some counting that's still taking place.
Trading Stocks After the Election
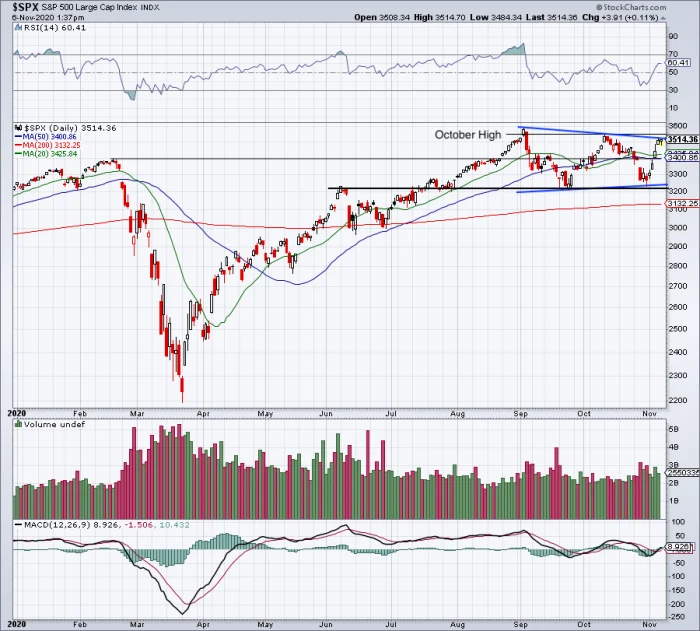
Daily chart of the S&P 500.
Chart courtesy of Stockcharts.com
Earlier this week I pointed out that the stock market favors the bulls over the long term, whether a Democrat or a Republican holds the Oval Office.
We're seeing that pan out this week, as investors seem to care more about clarity than which political party occupies the White House.
Obviously this is an atypical election, so if uncertainty crops up, it may cause a ripple in the market. But by and large we're setting up for a potential move higher from here.
Above is the S&P 500, but feel free to extrapolate a similar setup onto the chart of the SPDR S&P 500 ETF (SPY). As you can see, the index is running into wedge resistance.
If the bulls can break the index out over this mark, it quickly puts the October highs in play at about 3,550. Above that opens the door to the all-time high from September at 3,588 and puts a move to more new highs in play.
What if resistance holds firm?
As much as investors want to get bullish right now, I actually like the idea of a pullback from here.
As traders, we must be careful to separate what we want from what is happening in the market. But it wouldn't be the worst thing to see a dip into the 3,400 to 3,425 area.
Keep in mind: The market is working on its fifth straight daily gain and was up more than 9% when measured from last week's low to this week's high.
A decline to the 3,400 to 3,425 area would land the S&P 500 back into its 10-day, 20-day and 50-day moving averages. Further, it would send the index back to its pre-coronavirus 2020 highs.
A break of this range could put 3,250 on the table. But from here I am looking for either a breakout and rotation higher or a more modest dip into support.
From TheStreet.com